Peruvian vs Immigrants from Fiji Poverty
COMPARE
Peruvian
Immigrants from Fiji
Poverty
Poverty Comparison
Peruvians
Immigrants from Fiji
11.8%
POVERTY
85.6/ 100
METRIC RATING
132nd/ 347
METRIC RANK
12.2%
POVERTY
59.1/ 100
METRIC RATING
161st/ 347
METRIC RANK
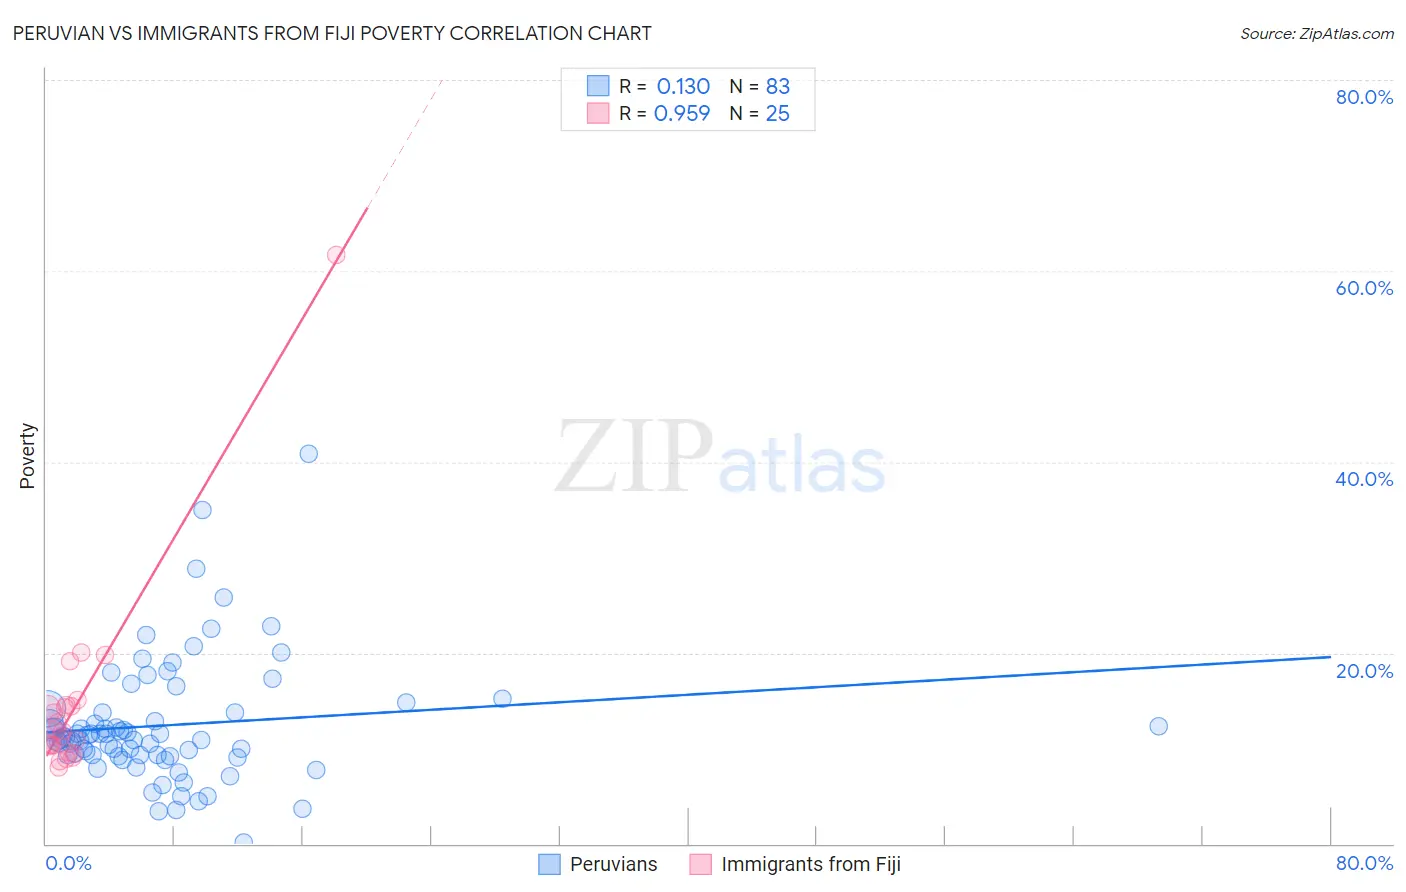
Peruvian vs Immigrants from Fiji Poverty Correlation Chart
The statistical analysis conducted on geographies consisting of 363,001,635 people shows a poor positive correlation between the proportion of Peruvians and poverty level in the United States with a correlation coefficient (R) of 0.130 and weighted average of 11.8%. Similarly, the statistical analysis conducted on geographies consisting of 93,754,900 people shows a perfect positive correlation between the proportion of Immigrants from Fiji and poverty level in the United States with a correlation coefficient (R) of 0.959 and weighted average of 12.2%, a difference of 3.6%.
Poverty Correlation Summary
| Measurement | Peruvian | Immigrants from Fiji |
| Minimum | 0.14% | 7.9% |
| Maximum | 40.8% | 61.7% |
| Range | 40.7% | 53.8% |
| Mean | 12.4% | 14.4% |
| Median | 11.2% | 11.8% |
| Interquartile 25% (IQ1) | 9.2% | 9.9% |
| Interquartile 75% (IQ3) | 13.8% | 14.5% |
| Interquartile Range (IQR) | 4.6% | 4.6% |
| Standard Deviation (Sample) | 6.5% | 10.4% |
| Standard Deviation (Population) | 6.4% | 10.2% |
Similar Demographics by Poverty
Demographics Similar to Peruvians by Poverty
In terms of poverty, the demographic groups most similar to Peruvians are Immigrants from Western Europe (11.8%, a difference of 0.070%), Yugoslavian (11.8%, a difference of 0.080%), Immigrants from Vietnam (11.8%, a difference of 0.090%), French (11.8%, a difference of 0.11%), and Immigrants from Ukraine (11.8%, a difference of 0.21%).
| Demographics | Rating | Rank | Poverty |
| Immigrants | Brazil | 88.2 /100 | #125 | Excellent 11.7% |
| Immigrants | Norway | 88.0 /100 | #126 | Excellent 11.7% |
| Immigrants | Argentina | 88.0 /100 | #127 | Excellent 11.7% |
| Immigrants | Israel | 87.4 /100 | #128 | Excellent 11.7% |
| South Africans | 87.0 /100 | #129 | Excellent 11.7% |
| Immigrants | Ukraine | 86.6 /100 | #130 | Excellent 11.8% |
| French | 86.1 /100 | #131 | Excellent 11.8% |
| Peruvians | 85.6 /100 | #132 | Excellent 11.8% |
| Immigrants | Western Europe | 85.2 /100 | #133 | Excellent 11.8% |
| Yugoslavians | 85.2 /100 | #134 | Excellent 11.8% |
| Immigrants | Vietnam | 85.2 /100 | #135 | Excellent 11.8% |
| Chileans | 84.2 /100 | #136 | Excellent 11.8% |
| Immigrants | Switzerland | 83.0 /100 | #137 | Excellent 11.8% |
| Immigrants | Jordan | 82.4 /100 | #138 | Excellent 11.9% |
| Pakistanis | 82.2 /100 | #139 | Excellent 11.9% |
Demographics Similar to Immigrants from Fiji by Poverty
In terms of poverty, the demographic groups most similar to Immigrants from Fiji are Ethiopian (12.2%, a difference of 0.010%), Immigrants from Ethiopia (12.2%, a difference of 0.060%), Immigrants from Nepal (12.2%, a difference of 0.13%), Colombian (12.2%, a difference of 0.13%), and Immigrants from Albania (12.2%, a difference of 0.14%).
| Demographics | Rating | Rank | Poverty |
| Guamanians/Chamorros | 63.9 /100 | #154 | Good 12.1% |
| Hungarians | 63.6 /100 | #155 | Good 12.2% |
| Scotch-Irish | 62.6 /100 | #156 | Good 12.2% |
| Costa Ricans | 62.2 /100 | #157 | Good 12.2% |
| Taiwanese | 61.8 /100 | #158 | Good 12.2% |
| Pennsylvania Germans | 60.8 /100 | #159 | Good 12.2% |
| Immigrants | Nepal | 60.4 /100 | #160 | Good 12.2% |
| Immigrants | Fiji | 59.1 /100 | #161 | Average 12.2% |
| Ethiopians | 59.1 /100 | #162 | Average 12.2% |
| Immigrants | Ethiopia | 58.6 /100 | #163 | Average 12.2% |
| Colombians | 57.8 /100 | #164 | Average 12.2% |
| Immigrants | Albania | 57.7 /100 | #165 | Average 12.2% |
| Venezuelans | 56.9 /100 | #166 | Average 12.2% |
| Immigrants | Chile | 56.7 /100 | #167 | Average 12.2% |
| Immigrants | Venezuela | 56.5 /100 | #168 | Average 12.2% |