Ethiopian vs Immigrants from Sri Lanka Married-Couple Family Poverty
COMPARE
Ethiopian
Immigrants from Sri Lanka
Married-Couple Family Poverty
Married-Couple Family Poverty Comparison
Ethiopians
Immigrants from Sri Lanka
5.1%
MARRIED-COUPLE FAMILY POVERTY
68.1/ 100
METRIC RATING
161st/ 347
METRIC RANK
4.4%
MARRIED-COUPLE FAMILY POVERTY
99.6/ 100
METRIC RATING
63rd/ 347
METRIC RANK
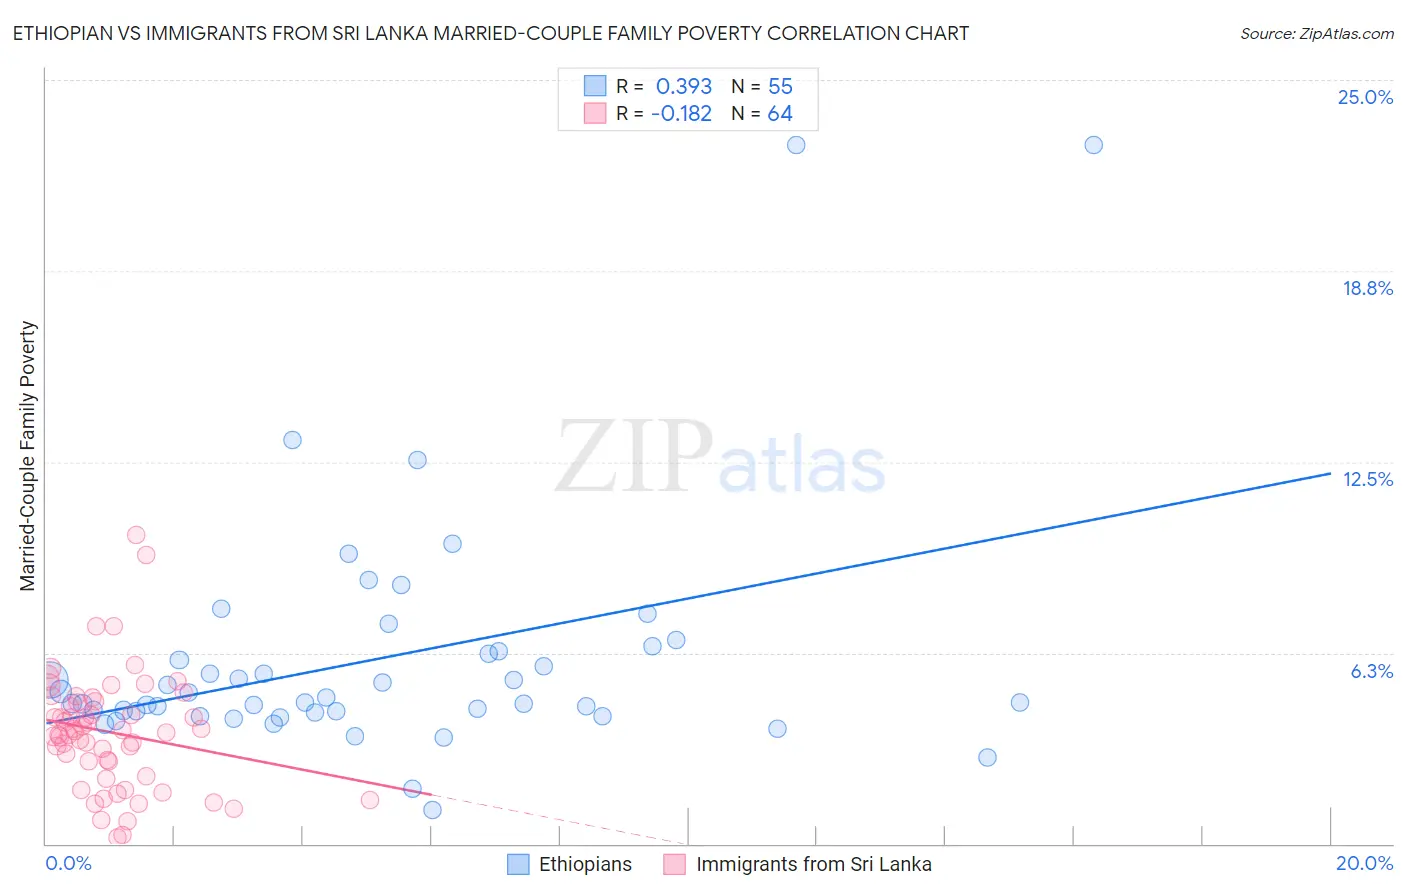
Ethiopian vs Immigrants from Sri Lanka Married-Couple Family Poverty Correlation Chart
The statistical analysis conducted on geographies consisting of 222,211,608 people shows a mild positive correlation between the proportion of Ethiopians and poverty level among married-couple families in the United States with a correlation coefficient (R) of 0.393 and weighted average of 5.1%. Similarly, the statistical analysis conducted on geographies consisting of 149,331,706 people shows a poor negative correlation between the proportion of Immigrants from Sri Lanka and poverty level among married-couple families in the United States with a correlation coefficient (R) of -0.182 and weighted average of 4.4%, a difference of 16.0%.
Married-Couple Family Poverty Correlation Summary
| Measurement | Ethiopian | Immigrants from Sri Lanka |
| Minimum | 1.1% | 0.22% |
| Maximum | 22.9% | 10.1% |
| Range | 21.8% | 9.9% |
| Mean | 6.0% | 3.7% |
| Median | 4.6% | 3.7% |
| Interquartile 25% (IQ1) | 4.3% | 2.5% |
| Interquartile 75% (IQ3) | 6.3% | 4.6% |
| Interquartile Range (IQR) | 2.0% | 2.2% |
| Standard Deviation (Sample) | 4.0% | 1.9% |
| Standard Deviation (Population) | 3.9% | 1.9% |
Similar Demographics by Married-Couple Family Poverty
Demographics Similar to Ethiopians by Married-Couple Family Poverty
In terms of married-couple family poverty, the demographic groups most similar to Ethiopians are Pennsylvania German (5.1%, a difference of 0.060%), Immigrants from Jordan (5.1%, a difference of 0.22%), Immigrants from South Eastern Asia (5.1%, a difference of 0.31%), Immigrants from Saudi Arabia (5.1%, a difference of 0.31%), and Argentinean (5.1%, a difference of 0.36%).
| Demographics | Rating | Rank | Married-Couple Family Poverty |
| Delaware | 73.7 /100 | #154 | Good 5.1% |
| Immigrants | Ethiopia | 72.4 /100 | #155 | Good 5.1% |
| Sri Lankans | 72.2 /100 | #156 | Good 5.1% |
| Argentineans | 70.7 /100 | #157 | Good 5.1% |
| Immigrants | South Eastern Asia | 70.4 /100 | #158 | Good 5.1% |
| Immigrants | Saudi Arabia | 70.3 /100 | #159 | Good 5.1% |
| Pennsylvania Germans | 68.5 /100 | #160 | Good 5.1% |
| Ethiopians | 68.1 /100 | #161 | Good 5.1% |
| Immigrants | Jordan | 66.5 /100 | #162 | Good 5.1% |
| Sierra Leoneans | 64.1 /100 | #163 | Good 5.1% |
| Hawaiians | 62.3 /100 | #164 | Good 5.1% |
| Immigrants | Malaysia | 62.2 /100 | #165 | Good 5.1% |
| Paraguayans | 61.5 /100 | #166 | Good 5.1% |
| Costa Ricans | 61.5 /100 | #167 | Good 5.1% |
| Immigrants | Uganda | 54.9 /100 | #168 | Average 5.2% |
Demographics Similar to Immigrants from Sri Lanka by Married-Couple Family Poverty
In terms of married-couple family poverty, the demographic groups most similar to Immigrants from Sri Lanka are Immigrants from Australia (4.4%, a difference of 0.36%), Okinawan (4.4%, a difference of 0.37%), Immigrants from Bulgaria (4.4%, a difference of 0.41%), Tlingit-Haida (4.4%, a difference of 0.49%), and Immigrants from Sweden (4.4%, a difference of 0.56%).
| Demographics | Rating | Rank | Married-Couple Family Poverty |
| Immigrants | Zimbabwe | 99.7 /100 | #56 | Exceptional 4.3% |
| Immigrants | Netherlands | 99.7 /100 | #57 | Exceptional 4.3% |
| Czechoslovakians | 99.7 /100 | #58 | Exceptional 4.4% |
| Immigrants | Sweden | 99.6 /100 | #59 | Exceptional 4.4% |
| Tlingit-Haida | 99.6 /100 | #60 | Exceptional 4.4% |
| Okinawans | 99.6 /100 | #61 | Exceptional 4.4% |
| Immigrants | Australia | 99.6 /100 | #62 | Exceptional 4.4% |
| Immigrants | Sri Lanka | 99.6 /100 | #63 | Exceptional 4.4% |
| Immigrants | Bulgaria | 99.5 /100 | #64 | Exceptional 4.4% |
| Macedonians | 99.4 /100 | #65 | Exceptional 4.4% |
| Immigrants | Serbia | 99.4 /100 | #66 | Exceptional 4.4% |
| Immigrants | Canada | 99.4 /100 | #67 | Exceptional 4.4% |
| Slavs | 99.4 /100 | #68 | Exceptional 4.4% |
| New Zealanders | 99.4 /100 | #69 | Exceptional 4.4% |
| Immigrants | Korea | 99.4 /100 | #70 | Exceptional 4.5% |