Ethiopian vs Immigrants from Southern Europe Married-Couple Family Poverty
COMPARE
Ethiopian
Immigrants from Southern Europe
Married-Couple Family Poverty
Married-Couple Family Poverty Comparison
Ethiopians
Immigrants from Southern Europe
5.1%
MARRIED-COUPLE FAMILY POVERTY
68.1/ 100
METRIC RATING
161st/ 347
METRIC RANK
4.8%
MARRIED-COUPLE FAMILY POVERTY
93.4/ 100
METRIC RATING
120th/ 347
METRIC RANK
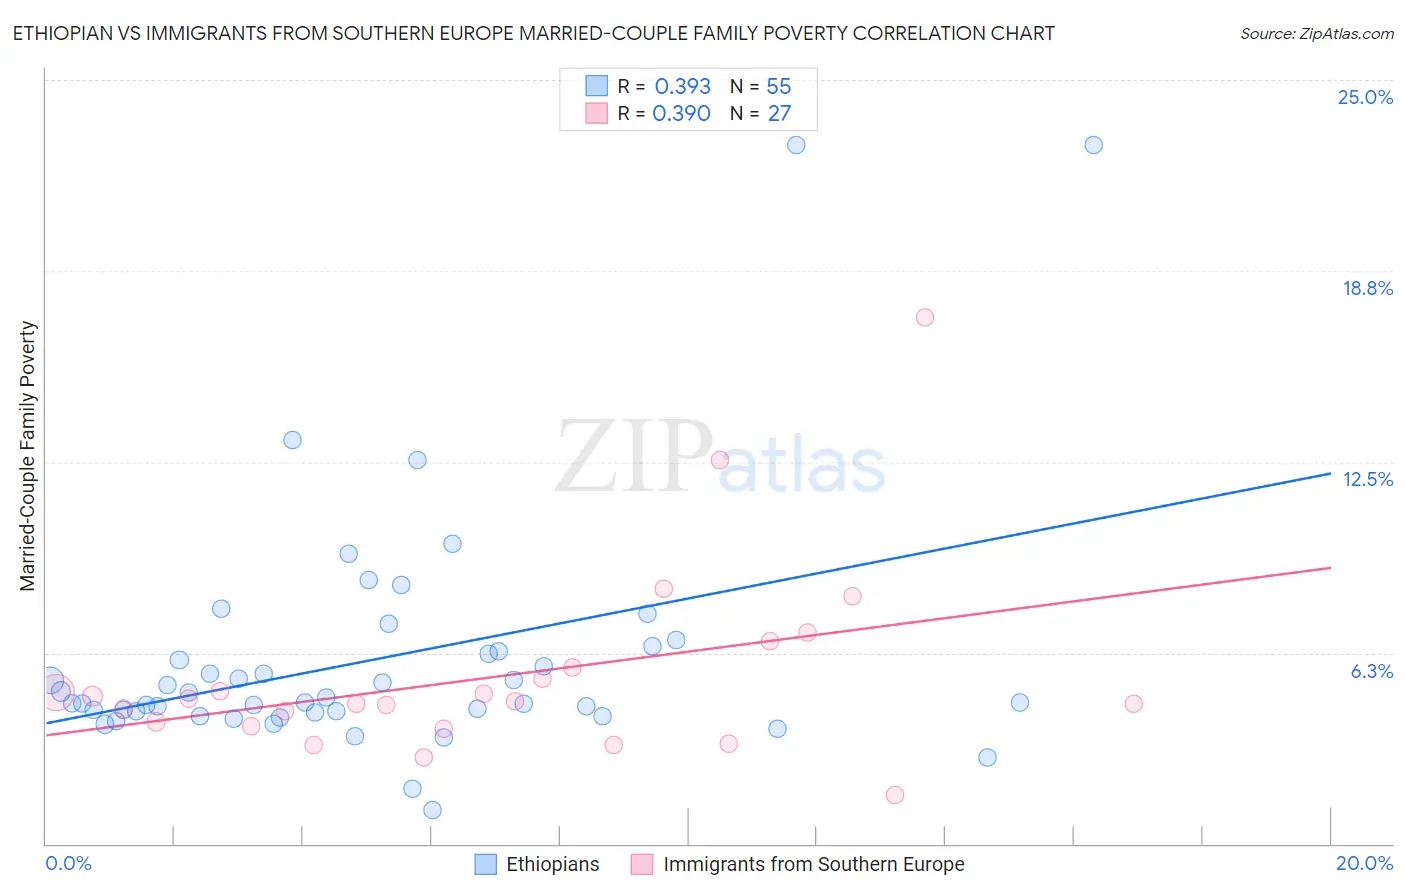
Ethiopian vs Immigrants from Southern Europe Married-Couple Family Poverty Correlation Chart
The statistical analysis conducted on geographies consisting of 222,211,608 people shows a mild positive correlation between the proportion of Ethiopians and poverty level among married-couple families in the United States with a correlation coefficient (R) of 0.393 and weighted average of 5.1%. Similarly, the statistical analysis conducted on geographies consisting of 398,530,737 people shows a mild positive correlation between the proportion of Immigrants from Southern Europe and poverty level among married-couple families in the United States with a correlation coefficient (R) of 0.390 and weighted average of 4.8%, a difference of 6.0%.
Married-Couple Family Poverty Correlation Summary
| Measurement | Ethiopian | Immigrants from Southern Europe |
| Minimum | 1.1% | 1.6% |
| Maximum | 22.9% | 17.2% |
| Range | 21.8% | 15.6% |
| Mean | 6.0% | 5.5% |
| Median | 4.6% | 4.7% |
| Interquartile 25% (IQ1) | 4.3% | 3.9% |
| Interquartile 75% (IQ3) | 6.3% | 5.8% |
| Interquartile Range (IQR) | 2.0% | 1.9% |
| Standard Deviation (Sample) | 4.0% | 3.2% |
| Standard Deviation (Population) | 3.9% | 3.1% |
Similar Demographics by Married-Couple Family Poverty
Demographics Similar to Ethiopians by Married-Couple Family Poverty
In terms of married-couple family poverty, the demographic groups most similar to Ethiopians are Pennsylvania German (5.1%, a difference of 0.060%), Immigrants from Jordan (5.1%, a difference of 0.22%), Immigrants from South Eastern Asia (5.1%, a difference of 0.31%), Immigrants from Saudi Arabia (5.1%, a difference of 0.31%), and Argentinean (5.1%, a difference of 0.36%).
| Demographics | Rating | Rank | Married-Couple Family Poverty |
| Delaware | 73.7 /100 | #154 | Good 5.1% |
| Immigrants | Ethiopia | 72.4 /100 | #155 | Good 5.1% |
| Sri Lankans | 72.2 /100 | #156 | Good 5.1% |
| Argentineans | 70.7 /100 | #157 | Good 5.1% |
| Immigrants | South Eastern Asia | 70.4 /100 | #158 | Good 5.1% |
| Immigrants | Saudi Arabia | 70.3 /100 | #159 | Good 5.1% |
| Pennsylvania Germans | 68.5 /100 | #160 | Good 5.1% |
| Ethiopians | 68.1 /100 | #161 | Good 5.1% |
| Immigrants | Jordan | 66.5 /100 | #162 | Good 5.1% |
| Sierra Leoneans | 64.1 /100 | #163 | Good 5.1% |
| Hawaiians | 62.3 /100 | #164 | Good 5.1% |
| Immigrants | Malaysia | 62.2 /100 | #165 | Good 5.1% |
| Paraguayans | 61.5 /100 | #166 | Good 5.1% |
| Costa Ricans | 61.5 /100 | #167 | Good 5.1% |
| Immigrants | Uganda | 54.9 /100 | #168 | Average 5.2% |
Demographics Similar to Immigrants from Southern Europe by Married-Couple Family Poverty
In terms of married-couple family poverty, the demographic groups most similar to Immigrants from Southern Europe are Indian (Asian) (4.8%, a difference of 0.090%), White/Caucasian (4.8%, a difference of 0.14%), Jordanian (4.8%, a difference of 0.16%), Immigrants from Eastern Asia (4.8%, a difference of 0.32%), and Romanian (4.8%, a difference of 0.43%).
| Demographics | Rating | Rank | Married-Couple Family Poverty |
| Immigrants | Nepal | 95.9 /100 | #113 | Exceptional 4.7% |
| Immigrants | Indonesia | 95.1 /100 | #114 | Exceptional 4.8% |
| Taiwanese | 94.8 /100 | #115 | Exceptional 4.8% |
| Celtics | 94.8 /100 | #116 | Exceptional 4.8% |
| Kenyans | 94.7 /100 | #117 | Exceptional 4.8% |
| Immigrants | Philippines | 94.6 /100 | #118 | Exceptional 4.8% |
| Immigrants | Eastern Asia | 94.0 /100 | #119 | Exceptional 4.8% |
| Immigrants | Southern Europe | 93.4 /100 | #120 | Exceptional 4.8% |
| Indians (Asian) | 93.2 /100 | #121 | Exceptional 4.8% |
| Whites/Caucasians | 93.1 /100 | #122 | Exceptional 4.8% |
| Jordanians | 93.1 /100 | #123 | Exceptional 4.8% |
| Romanians | 92.5 /100 | #124 | Exceptional 4.8% |
| Immigrants | Bosnia and Herzegovina | 92.5 /100 | #125 | Exceptional 4.8% |
| Immigrants | Asia | 92.3 /100 | #126 | Exceptional 4.8% |
| Egyptians | 92.0 /100 | #127 | Exceptional 4.8% |