Bulgarian vs Immigrants from Sri Lanka Married-Couple Family Poverty
COMPARE
Bulgarian
Immigrants from Sri Lanka
Married-Couple Family Poverty
Married-Couple Family Poverty Comparison
Bulgarians
Immigrants from Sri Lanka
4.0%
MARRIED-COUPLE FAMILY POVERTY
100.0/ 100
METRIC RATING
12th/ 347
METRIC RANK
4.4%
MARRIED-COUPLE FAMILY POVERTY
99.6/ 100
METRIC RATING
63rd/ 347
METRIC RANK
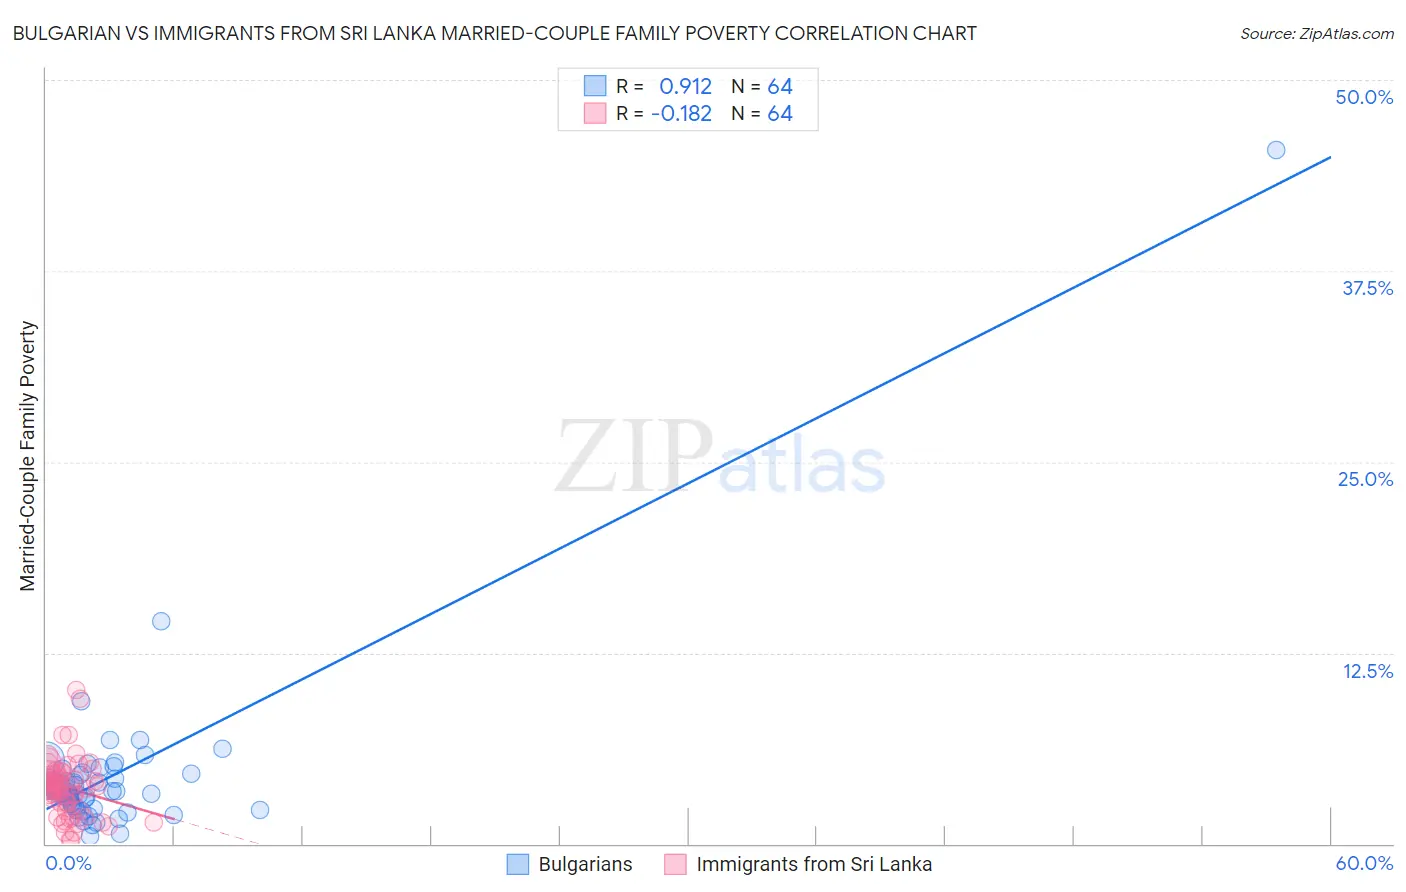
Bulgarian vs Immigrants from Sri Lanka Married-Couple Family Poverty Correlation Chart
The statistical analysis conducted on geographies consisting of 204,671,341 people shows a near-perfect positive correlation between the proportion of Bulgarians and poverty level among married-couple families in the United States with a correlation coefficient (R) of 0.912 and weighted average of 4.0%. Similarly, the statistical analysis conducted on geographies consisting of 149,331,706 people shows a poor negative correlation between the proportion of Immigrants from Sri Lanka and poverty level among married-couple families in the United States with a correlation coefficient (R) of -0.182 and weighted average of 4.4%, a difference of 10.3%.
Married-Couple Family Poverty Correlation Summary
| Measurement | Bulgarian | Immigrants from Sri Lanka |
| Minimum | 0.47% | 0.22% |
| Maximum | 45.5% | 10.1% |
| Range | 45.0% | 9.9% |
| Mean | 4.4% | 3.7% |
| Median | 3.5% | 3.7% |
| Interquartile 25% (IQ1) | 2.6% | 2.5% |
| Interquartile 75% (IQ3) | 4.4% | 4.6% |
| Interquartile Range (IQR) | 1.8% | 2.2% |
| Standard Deviation (Sample) | 5.6% | 1.9% |
| Standard Deviation (Population) | 5.6% | 1.9% |
Similar Demographics by Married-Couple Family Poverty
Demographics Similar to Bulgarians by Married-Couple Family Poverty
In terms of married-couple family poverty, the demographic groups most similar to Bulgarians are Lithuanian (4.0%, a difference of 0.70%), Czech (4.0%, a difference of 0.88%), Slovak (4.0%, a difference of 0.92%), Polish (4.0%, a difference of 0.95%), and Carpatho Rusyn (3.9%, a difference of 1.2%).
| Demographics | Rating | Rank | Married-Couple Family Poverty |
| Swedes | 100.0 /100 | #5 | Exceptional 3.9% |
| Luxembourgers | 100.0 /100 | #6 | Exceptional 3.9% |
| Latvians | 100.0 /100 | #7 | Exceptional 3.9% |
| Thais | 100.0 /100 | #8 | Exceptional 3.9% |
| Croatians | 100.0 /100 | #9 | Exceptional 3.9% |
| Carpatho Rusyns | 100.0 /100 | #10 | Exceptional 3.9% |
| Lithuanians | 100.0 /100 | #11 | Exceptional 4.0% |
| Bulgarians | 100.0 /100 | #12 | Exceptional 4.0% |
| Czechs | 100.0 /100 | #13 | Exceptional 4.0% |
| Slovaks | 100.0 /100 | #14 | Exceptional 4.0% |
| Poles | 100.0 /100 | #15 | Exceptional 4.0% |
| Germans | 100.0 /100 | #16 | Exceptional 4.0% |
| Filipinos | 100.0 /100 | #17 | Exceptional 4.0% |
| Italians | 100.0 /100 | #18 | Exceptional 4.0% |
| Immigrants | Ireland | 99.9 /100 | #19 | Exceptional 4.1% |
Demographics Similar to Immigrants from Sri Lanka by Married-Couple Family Poverty
In terms of married-couple family poverty, the demographic groups most similar to Immigrants from Sri Lanka are Immigrants from Australia (4.4%, a difference of 0.36%), Okinawan (4.4%, a difference of 0.37%), Immigrants from Bulgaria (4.4%, a difference of 0.41%), Tlingit-Haida (4.4%, a difference of 0.49%), and Immigrants from Sweden (4.4%, a difference of 0.56%).
| Demographics | Rating | Rank | Married-Couple Family Poverty |
| Immigrants | Zimbabwe | 99.7 /100 | #56 | Exceptional 4.3% |
| Immigrants | Netherlands | 99.7 /100 | #57 | Exceptional 4.3% |
| Czechoslovakians | 99.7 /100 | #58 | Exceptional 4.4% |
| Immigrants | Sweden | 99.6 /100 | #59 | Exceptional 4.4% |
| Tlingit-Haida | 99.6 /100 | #60 | Exceptional 4.4% |
| Okinawans | 99.6 /100 | #61 | Exceptional 4.4% |
| Immigrants | Australia | 99.6 /100 | #62 | Exceptional 4.4% |
| Immigrants | Sri Lanka | 99.6 /100 | #63 | Exceptional 4.4% |
| Immigrants | Bulgaria | 99.5 /100 | #64 | Exceptional 4.4% |
| Macedonians | 99.4 /100 | #65 | Exceptional 4.4% |
| Immigrants | Serbia | 99.4 /100 | #66 | Exceptional 4.4% |
| Immigrants | Canada | 99.4 /100 | #67 | Exceptional 4.4% |
| Slavs | 99.4 /100 | #68 | Exceptional 4.4% |
| New Zealanders | 99.4 /100 | #69 | Exceptional 4.4% |
| Immigrants | Korea | 99.4 /100 | #70 | Exceptional 4.5% |