Ethiopian vs Immigrants from Senegal Median Earnings
COMPARE
Ethiopian
Immigrants from Senegal
Median Earnings
Median Earnings Comparison
Ethiopians
Immigrants from Senegal
$49,572
MEDIAN EARNINGS
98.8/ 100
METRIC RATING
102nd/ 347
METRIC RANK
$45,611
MEDIAN EARNINGS
24.0/ 100
METRIC RATING
207th/ 347
METRIC RANK
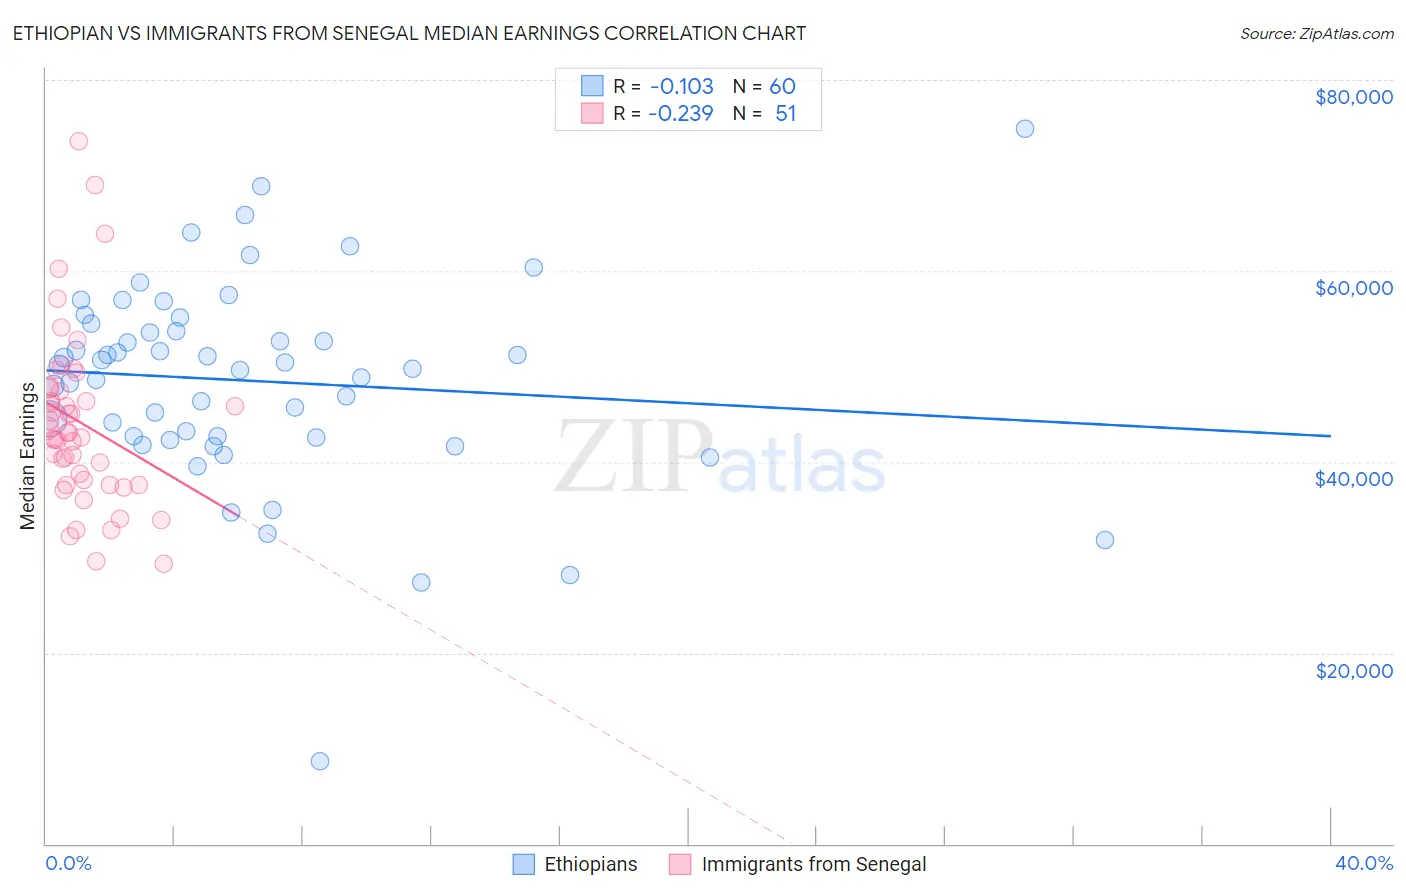
Ethiopian vs Immigrants from Senegal Median Earnings Correlation Chart
The statistical analysis conducted on geographies consisting of 223,260,849 people shows a poor negative correlation between the proportion of Ethiopians and median earnings in the United States with a correlation coefficient (R) of -0.103 and weighted average of $49,572. Similarly, the statistical analysis conducted on geographies consisting of 90,128,045 people shows a weak negative correlation between the proportion of Immigrants from Senegal and median earnings in the United States with a correlation coefficient (R) of -0.239 and weighted average of $45,611, a difference of 8.7%.
Median Earnings Correlation Summary
| Measurement | Ethiopian | Immigrants from Senegal |
| Minimum | $8,623 | $29,284 |
| Maximum | $74,844 | $73,618 |
| Range | $66,221 | $44,334 |
| Mean | $48,479 | $44,131 |
| Median | $49,984 | $43,043 |
| Interquartile 25% (IQ1) | $42,620 | $37,628 |
| Interquartile 75% (IQ3) | $54,089 | $47,719 |
| Interquartile Range (IQR) | $11,470 | $10,091 |
| Standard Deviation (Sample) | $10,733 | $9,098 |
| Standard Deviation (Population) | $10,643 | $9,008 |
Similar Demographics by Median Earnings
Demographics Similar to Ethiopians by Median Earnings
In terms of median earnings, the demographic groups most similar to Ethiopians are Immigrants from Poland ($49,633, a difference of 0.12%), Jordanian ($49,632, a difference of 0.12%), Austrian ($49,501, a difference of 0.14%), Immigrants from Northern Africa ($49,648, a difference of 0.15%), and Immigrants from Afghanistan ($49,645, a difference of 0.15%).
| Demographics | Rating | Rank | Median Earnings |
| Immigrants | England | 99.0 /100 | #95 | Exceptional $49,722 |
| Immigrants | Lebanon | 99.0 /100 | #96 | Exceptional $49,682 |
| Immigrants | North Macedonia | 98.9 /100 | #97 | Exceptional $49,658 |
| Immigrants | Northern Africa | 98.9 /100 | #98 | Exceptional $49,648 |
| Immigrants | Afghanistan | 98.9 /100 | #99 | Exceptional $49,645 |
| Immigrants | Poland | 98.9 /100 | #100 | Exceptional $49,633 |
| Jordanians | 98.9 /100 | #101 | Exceptional $49,632 |
| Ethiopians | 98.8 /100 | #102 | Exceptional $49,572 |
| Austrians | 98.7 /100 | #103 | Exceptional $49,501 |
| Immigrants | Brazil | 98.6 /100 | #104 | Exceptional $49,463 |
| Immigrants | Western Asia | 98.4 /100 | #105 | Exceptional $49,389 |
| Immigrants | Albania | 98.4 /100 | #106 | Exceptional $49,377 |
| Immigrants | Morocco | 98.4 /100 | #107 | Exceptional $49,368 |
| Palestinians | 98.0 /100 | #108 | Exceptional $49,209 |
| Syrians | 97.1 /100 | #109 | Exceptional $48,934 |
Demographics Similar to Immigrants from Senegal by Median Earnings
In terms of median earnings, the demographic groups most similar to Immigrants from Senegal are Immigrants from Bosnia and Herzegovina ($45,600, a difference of 0.020%), Immigrants from Thailand ($45,598, a difference of 0.030%), Immigrants from Grenada ($45,596, a difference of 0.030%), Panamanian ($45,593, a difference of 0.040%), and Bermudan ($45,593, a difference of 0.040%).
| Demographics | Rating | Rank | Median Earnings |
| Immigrants | Azores | 29.5 /100 | #200 | Fair $45,812 |
| Celtics | 27.2 /100 | #201 | Fair $45,732 |
| Immigrants | Trinidad and Tobago | 27.1 /100 | #202 | Fair $45,729 |
| Welsh | 26.6 /100 | #203 | Fair $45,710 |
| Immigrants | Uruguay | 25.9 /100 | #204 | Fair $45,682 |
| Tongans | 25.4 /100 | #205 | Fair $45,665 |
| Immigrants | Ghana | 24.8 /100 | #206 | Fair $45,641 |
| Immigrants | Senegal | 24.0 /100 | #207 | Fair $45,611 |
| Immigrants | Bosnia and Herzegovina | 23.7 /100 | #208 | Fair $45,600 |
| Immigrants | Thailand | 23.7 /100 | #209 | Fair $45,598 |
| Immigrants | Grenada | 23.6 /100 | #210 | Fair $45,596 |
| Panamanians | 23.5 /100 | #211 | Fair $45,593 |
| Bermudans | 23.5 /100 | #212 | Fair $45,593 |
| Immigrants | Colombia | 22.4 /100 | #213 | Fair $45,550 |
| Nigerians | 22.0 /100 | #214 | Fair $45,532 |