Immigrants from Nepal vs Immigrants from Senegal Poverty
COMPARE
Immigrants from Nepal
Immigrants from Senegal
Poverty
Poverty Comparison
Immigrants from Nepal
Immigrants from Senegal
12.2%
POVERTY
60.4/ 100
METRIC RATING
160th/ 347
METRIC RANK
15.3%
POVERTY
0.0/ 100
METRIC RATING
298th/ 347
METRIC RANK
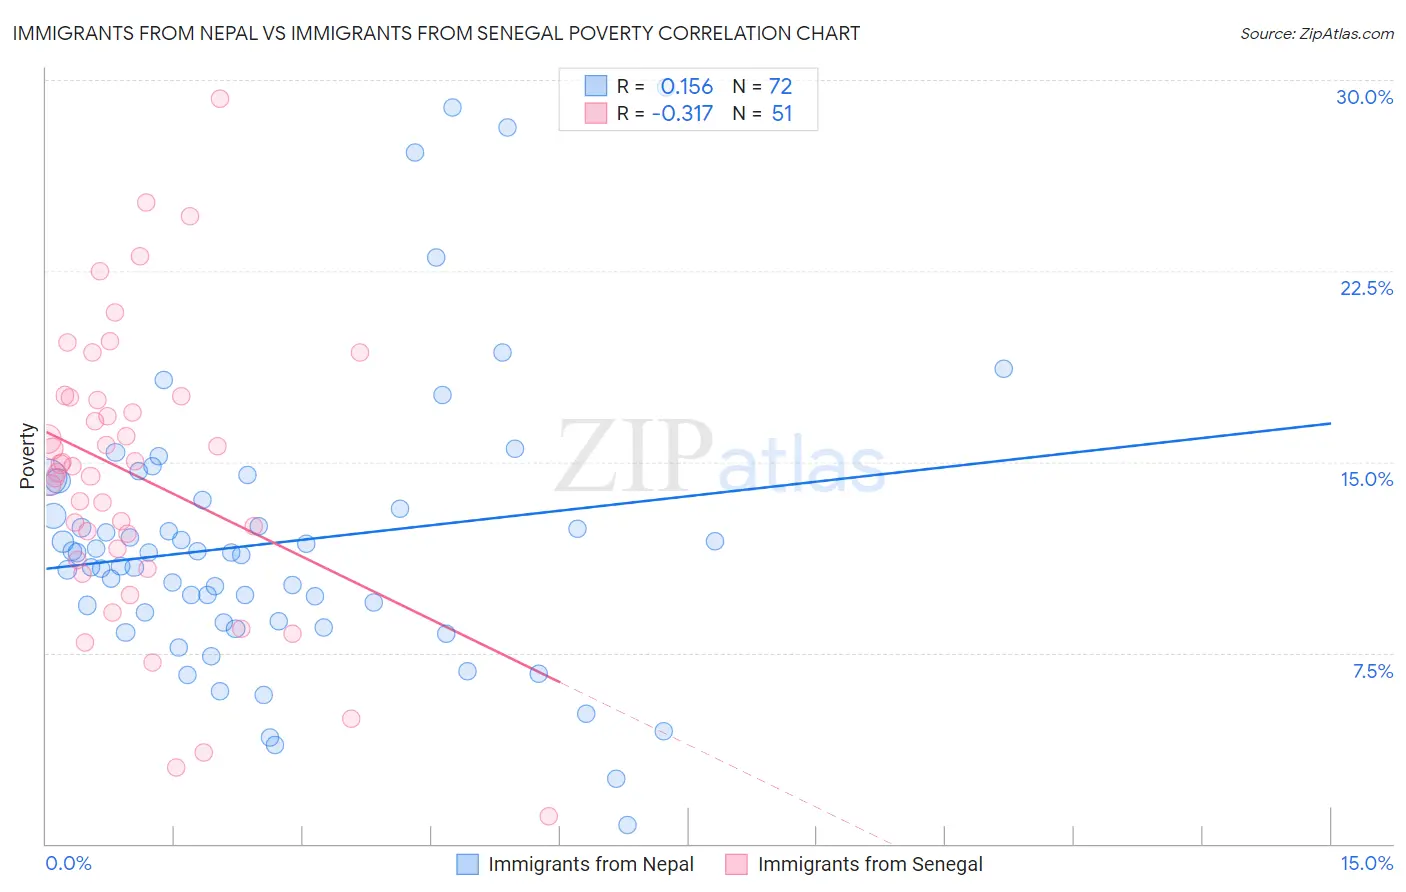
Immigrants from Nepal vs Immigrants from Senegal Poverty Correlation Chart
The statistical analysis conducted on geographies consisting of 186,715,196 people shows a poor positive correlation between the proportion of Immigrants from Nepal and poverty level in the United States with a correlation coefficient (R) of 0.156 and weighted average of 12.2%. Similarly, the statistical analysis conducted on geographies consisting of 90,124,695 people shows a mild negative correlation between the proportion of Immigrants from Senegal and poverty level in the United States with a correlation coefficient (R) of -0.317 and weighted average of 15.3%, a difference of 25.4%.
Poverty Correlation Summary
| Measurement | Immigrants from Nepal | Immigrants from Senegal |
| Minimum | 0.73% | 1.1% |
| Maximum | 29.7% | 29.3% |
| Range | 29.0% | 28.2% |
| Mean | 11.8% | 14.4% |
| Median | 11.4% | 14.8% |
| Interquartile 25% (IQ1) | 8.7% | 11.1% |
| Interquartile 75% (IQ3) | 13.3% | 17.5% |
| Interquartile Range (IQR) | 4.6% | 6.4% |
| Standard Deviation (Sample) | 5.6% | 5.6% |
| Standard Deviation (Population) | 5.6% | 5.6% |
Similar Demographics by Poverty
Demographics Similar to Immigrants from Nepal by Poverty
In terms of poverty, the demographic groups most similar to Immigrants from Nepal are Pennsylvania German (12.2%, a difference of 0.050%), Immigrants from Fiji (12.2%, a difference of 0.13%), Ethiopian (12.2%, a difference of 0.13%), Taiwanese (12.2%, a difference of 0.15%), and Immigrants from Ethiopia (12.2%, a difference of 0.18%).
| Demographics | Rating | Rank | Poverty |
| Immigrants | Northern Africa | 63.9 /100 | #153 | Good 12.1% |
| Guamanians/Chamorros | 63.9 /100 | #154 | Good 12.1% |
| Hungarians | 63.6 /100 | #155 | Good 12.2% |
| Scotch-Irish | 62.6 /100 | #156 | Good 12.2% |
| Costa Ricans | 62.2 /100 | #157 | Good 12.2% |
| Taiwanese | 61.8 /100 | #158 | Good 12.2% |
| Pennsylvania Germans | 60.8 /100 | #159 | Good 12.2% |
| Immigrants | Nepal | 60.4 /100 | #160 | Good 12.2% |
| Immigrants | Fiji | 59.1 /100 | #161 | Average 12.2% |
| Ethiopians | 59.1 /100 | #162 | Average 12.2% |
| Immigrants | Ethiopia | 58.6 /100 | #163 | Average 12.2% |
| Colombians | 57.8 /100 | #164 | Average 12.2% |
| Immigrants | Albania | 57.7 /100 | #165 | Average 12.2% |
| Venezuelans | 56.9 /100 | #166 | Average 12.2% |
| Immigrants | Chile | 56.7 /100 | #167 | Average 12.2% |
Demographics Similar to Immigrants from Senegal by Poverty
In terms of poverty, the demographic groups most similar to Immigrants from Senegal are Senegalese (15.3%, a difference of 0.090%), Immigrants from Bangladesh (15.3%, a difference of 0.15%), Hispanic or Latino (15.3%, a difference of 0.19%), Guatemalan (15.3%, a difference of 0.20%), and Immigrants from Central America (15.4%, a difference of 0.47%).
| Demographics | Rating | Rank | Poverty |
| Immigrants | Cabo Verde | 0.0 /100 | #291 | Tragic 15.1% |
| Indonesians | 0.0 /100 | #292 | Tragic 15.1% |
| Immigrants | Zaire | 0.0 /100 | #293 | Tragic 15.1% |
| Blackfeet | 0.0 /100 | #294 | Tragic 15.2% |
| Guatemalans | 0.0 /100 | #295 | Tragic 15.3% |
| Hispanics or Latinos | 0.0 /100 | #296 | Tragic 15.3% |
| Immigrants | Bangladesh | 0.0 /100 | #297 | Tragic 15.3% |
| Immigrants | Senegal | 0.0 /100 | #298 | Tragic 15.3% |
| Senegalese | 0.0 /100 | #299 | Tragic 15.3% |
| Immigrants | Central America | 0.0 /100 | #300 | Tragic 15.4% |
| Bahamians | 0.0 /100 | #301 | Tragic 15.4% |
| Somalis | 0.0 /100 | #302 | Tragic 15.4% |
| Immigrants | Caribbean | 0.0 /100 | #303 | Tragic 15.5% |
| Immigrants | Mexico | 0.0 /100 | #304 | Tragic 15.5% |
| Immigrants | Guatemala | 0.0 /100 | #305 | Tragic 15.5% |