Menominee vs Immigrants from Senegal Poverty
COMPARE
Menominee
Immigrants from Senegal
Poverty
Poverty Comparison
Menominee
Immigrants from Senegal
16.4%
POVERTY
0.0/ 100
METRIC RATING
322nd/ 347
METRIC RANK
15.3%
POVERTY
0.0/ 100
METRIC RATING
298th/ 347
METRIC RANK
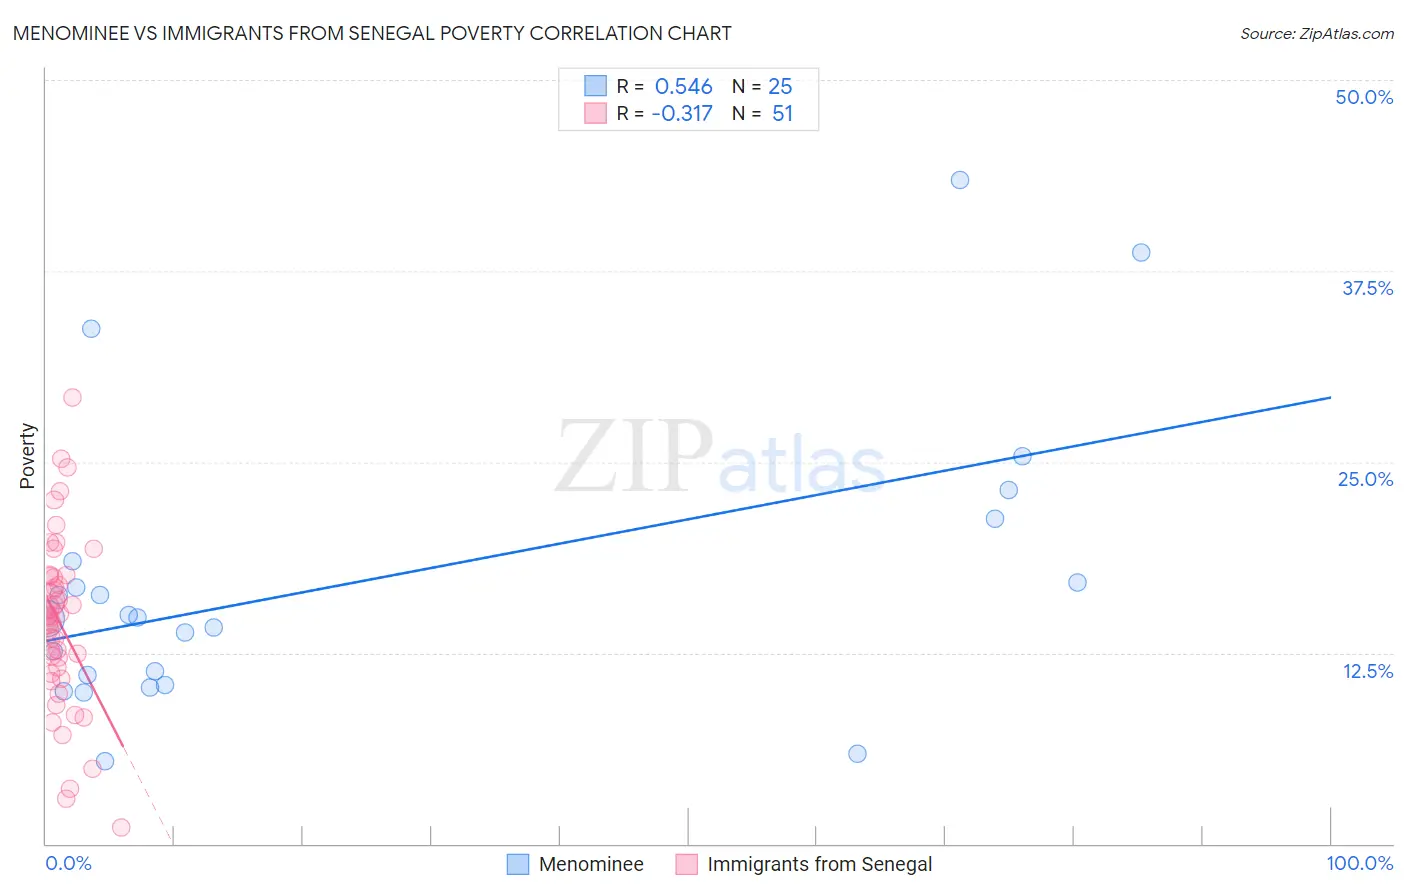
Menominee vs Immigrants from Senegal Poverty Correlation Chart
The statistical analysis conducted on geographies consisting of 45,777,730 people shows a substantial positive correlation between the proportion of Menominee and poverty level in the United States with a correlation coefficient (R) of 0.546 and weighted average of 16.4%. Similarly, the statistical analysis conducted on geographies consisting of 90,124,695 people shows a mild negative correlation between the proportion of Immigrants from Senegal and poverty level in the United States with a correlation coefficient (R) of -0.317 and weighted average of 15.3%, a difference of 7.6%.
Poverty Correlation Summary
| Measurement | Menominee | Immigrants from Senegal |
| Minimum | 5.4% | 1.1% |
| Maximum | 43.5% | 29.3% |
| Range | 38.1% | 28.2% |
| Mean | 17.2% | 14.4% |
| Median | 14.8% | 14.8% |
| Interquartile 25% (IQ1) | 10.7% | 11.1% |
| Interquartile 75% (IQ3) | 19.9% | 17.5% |
| Interquartile Range (IQR) | 9.2% | 6.4% |
| Standard Deviation (Sample) | 9.5% | 5.6% |
| Standard Deviation (Population) | 9.3% | 5.6% |
Similar Demographics by Poverty
Demographics Similar to Menominee by Poverty
In terms of poverty, the demographic groups most similar to Menominee are Colville (16.6%, a difference of 0.75%), Arapaho (16.3%, a difference of 0.96%), Yakama (16.7%, a difference of 1.3%), Central American Indian (16.7%, a difference of 1.5%), and Immigrants from Honduras (16.2%, a difference of 1.7%).
| Demographics | Rating | Rank | Poverty |
| British West Indians | 0.0 /100 | #315 | Tragic 15.9% |
| Hondurans | 0.0 /100 | #316 | Tragic 15.9% |
| U.S. Virgin Islanders | 0.0 /100 | #317 | Tragic 16.1% |
| Immigrants | Dominica | 0.0 /100 | #318 | Tragic 16.1% |
| Immigrants | Congo | 0.0 /100 | #319 | Tragic 16.1% |
| Immigrants | Honduras | 0.0 /100 | #320 | Tragic 16.2% |
| Arapaho | 0.0 /100 | #321 | Tragic 16.3% |
| Menominee | 0.0 /100 | #322 | Tragic 16.4% |
| Colville | 0.0 /100 | #323 | Tragic 16.6% |
| Yakama | 0.0 /100 | #324 | Tragic 16.7% |
| Central American Indians | 0.0 /100 | #325 | Tragic 16.7% |
| Paiute | 0.0 /100 | #326 | Tragic 16.7% |
| Kiowa | 0.0 /100 | #327 | Tragic 16.8% |
| Ute | 0.0 /100 | #328 | Tragic 16.9% |
| Blacks/African Americans | 0.0 /100 | #329 | Tragic 17.3% |
Demographics Similar to Immigrants from Senegal by Poverty
In terms of poverty, the demographic groups most similar to Immigrants from Senegal are Senegalese (15.3%, a difference of 0.090%), Immigrants from Bangladesh (15.3%, a difference of 0.15%), Hispanic or Latino (15.3%, a difference of 0.19%), Guatemalan (15.3%, a difference of 0.20%), and Immigrants from Central America (15.4%, a difference of 0.47%).
| Demographics | Rating | Rank | Poverty |
| Immigrants | Cabo Verde | 0.0 /100 | #291 | Tragic 15.1% |
| Indonesians | 0.0 /100 | #292 | Tragic 15.1% |
| Immigrants | Zaire | 0.0 /100 | #293 | Tragic 15.1% |
| Blackfeet | 0.0 /100 | #294 | Tragic 15.2% |
| Guatemalans | 0.0 /100 | #295 | Tragic 15.3% |
| Hispanics or Latinos | 0.0 /100 | #296 | Tragic 15.3% |
| Immigrants | Bangladesh | 0.0 /100 | #297 | Tragic 15.3% |
| Immigrants | Senegal | 0.0 /100 | #298 | Tragic 15.3% |
| Senegalese | 0.0 /100 | #299 | Tragic 15.3% |
| Immigrants | Central America | 0.0 /100 | #300 | Tragic 15.4% |
| Bahamians | 0.0 /100 | #301 | Tragic 15.4% |
| Somalis | 0.0 /100 | #302 | Tragic 15.4% |
| Immigrants | Caribbean | 0.0 /100 | #303 | Tragic 15.5% |
| Immigrants | Mexico | 0.0 /100 | #304 | Tragic 15.5% |
| Immigrants | Guatemala | 0.0 /100 | #305 | Tragic 15.5% |