Immigrants from Hong Kong vs French Canadian Family Poverty
COMPARE
Immigrants from Hong Kong
French Canadian
Family Poverty
Family Poverty Comparison
Immigrants from Hong Kong
French Canadians
7.3%
FAMILY POVERTY
99.7/ 100
METRIC RATING
20th/ 347
METRIC RANK
8.1%
FAMILY POVERTY
95.0/ 100
METRIC RATING
107th/ 347
METRIC RANK
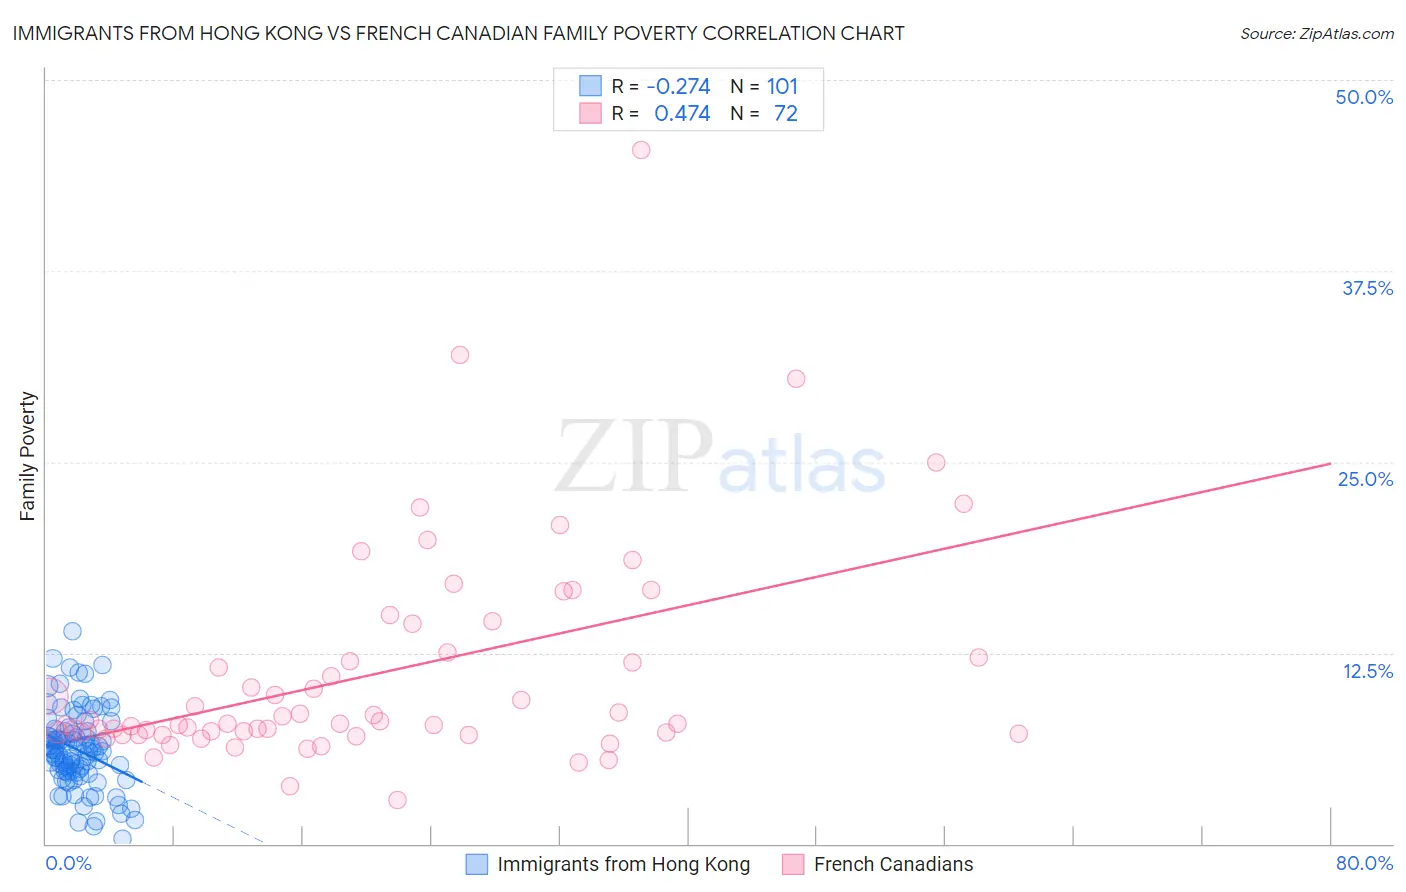
Immigrants from Hong Kong vs French Canadian Family Poverty Correlation Chart
The statistical analysis conducted on geographies consisting of 253,546,628 people shows a weak negative correlation between the proportion of Immigrants from Hong Kong and poverty level among families in the United States with a correlation coefficient (R) of -0.274 and weighted average of 7.3%. Similarly, the statistical analysis conducted on geographies consisting of 499,881,871 people shows a moderate positive correlation between the proportion of French Canadians and poverty level among families in the United States with a correlation coefficient (R) of 0.474 and weighted average of 8.1%, a difference of 12.2%.
Family Poverty Correlation Summary
| Measurement | Immigrants from Hong Kong | French Canadian |
| Minimum | 0.35% | 2.9% |
| Maximum | 13.9% | 45.5% |
| Range | 13.5% | 42.6% |
| Mean | 6.2% | 11.1% |
| Median | 6.1% | 7.9% |
| Interquartile 25% (IQ1) | 4.7% | 7.2% |
| Interquartile 75% (IQ3) | 7.4% | 12.3% |
| Interquartile Range (IQR) | 2.6% | 5.1% |
| Standard Deviation (Sample) | 2.6% | 7.2% |
| Standard Deviation (Population) | 2.5% | 7.1% |
Similar Demographics by Family Poverty
Demographics Similar to Immigrants from Hong Kong by Family Poverty
In terms of family poverty, the demographic groups most similar to Immigrants from Hong Kong are Eastern European (7.2%, a difference of 0.16%), Immigrants from Iran (7.3%, a difference of 0.20%), Immigrants from Lithuania (7.2%, a difference of 0.46%), Luxembourger (7.2%, a difference of 0.48%), and Danish (7.3%, a difference of 0.64%).
| Demographics | Rating | Rank | Family Poverty |
| Swedes | 99.8 /100 | #13 | Exceptional 7.1% |
| Iranians | 99.8 /100 | #14 | Exceptional 7.1% |
| Lithuanians | 99.8 /100 | #15 | Exceptional 7.2% |
| Immigrants | South Central Asia | 99.8 /100 | #16 | Exceptional 7.2% |
| Luxembourgers | 99.8 /100 | #17 | Exceptional 7.2% |
| Immigrants | Lithuania | 99.8 /100 | #18 | Exceptional 7.2% |
| Eastern Europeans | 99.7 /100 | #19 | Exceptional 7.2% |
| Immigrants | Hong Kong | 99.7 /100 | #20 | Exceptional 7.3% |
| Immigrants | Iran | 99.7 /100 | #21 | Exceptional 7.3% |
| Danes | 99.7 /100 | #22 | Exceptional 7.3% |
| Assyrians/Chaldeans/Syriacs | 99.7 /100 | #23 | Exceptional 7.3% |
| Croatians | 99.7 /100 | #24 | Exceptional 7.3% |
| Burmese | 99.7 /100 | #25 | Exceptional 7.3% |
| Cypriots | 99.6 /100 | #26 | Exceptional 7.3% |
| Immigrants | Scotland | 99.6 /100 | #27 | Exceptional 7.3% |
Demographics Similar to French Canadians by Family Poverty
In terms of family poverty, the demographic groups most similar to French Canadians are Egyptian (8.1%, a difference of 0.040%), Basque (8.1%, a difference of 0.090%), Jordanian (8.2%, a difference of 0.18%), Romanian (8.2%, a difference of 0.27%), and Taiwanese (8.2%, a difference of 0.32%).
| Demographics | Rating | Rank | Family Poverty |
| New Zealanders | 95.8 /100 | #100 | Exceptional 8.1% |
| Immigrants | Norway | 95.7 /100 | #101 | Exceptional 8.1% |
| Immigrants | Indonesia | 95.7 /100 | #102 | Exceptional 8.1% |
| Immigrants | Eastern Europe | 95.6 /100 | #103 | Exceptional 8.1% |
| Slavs | 95.6 /100 | #104 | Exceptional 8.1% |
| Laotians | 95.6 /100 | #105 | Exceptional 8.1% |
| Egyptians | 95.1 /100 | #106 | Exceptional 8.1% |
| French Canadians | 95.0 /100 | #107 | Exceptional 8.1% |
| Basques | 94.9 /100 | #108 | Exceptional 8.1% |
| Jordanians | 94.8 /100 | #109 | Exceptional 8.2% |
| Romanians | 94.7 /100 | #110 | Exceptional 8.2% |
| Taiwanese | 94.6 /100 | #111 | Exceptional 8.2% |
| Immigrants | France | 94.4 /100 | #112 | Exceptional 8.2% |
| Canadians | 94.2 /100 | #113 | Exceptional 8.2% |
| Immigrants | Zimbabwe | 94.0 /100 | #114 | Exceptional 8.2% |