Seminole vs French Canadian Family Poverty
COMPARE
Seminole
French Canadian
Family Poverty
Family Poverty Comparison
Seminole
French Canadians
11.9%
FAMILY POVERTY
0.0/ 100
METRIC RATING
308th/ 347
METRIC RANK
8.1%
FAMILY POVERTY
95.0/ 100
METRIC RATING
107th/ 347
METRIC RANK
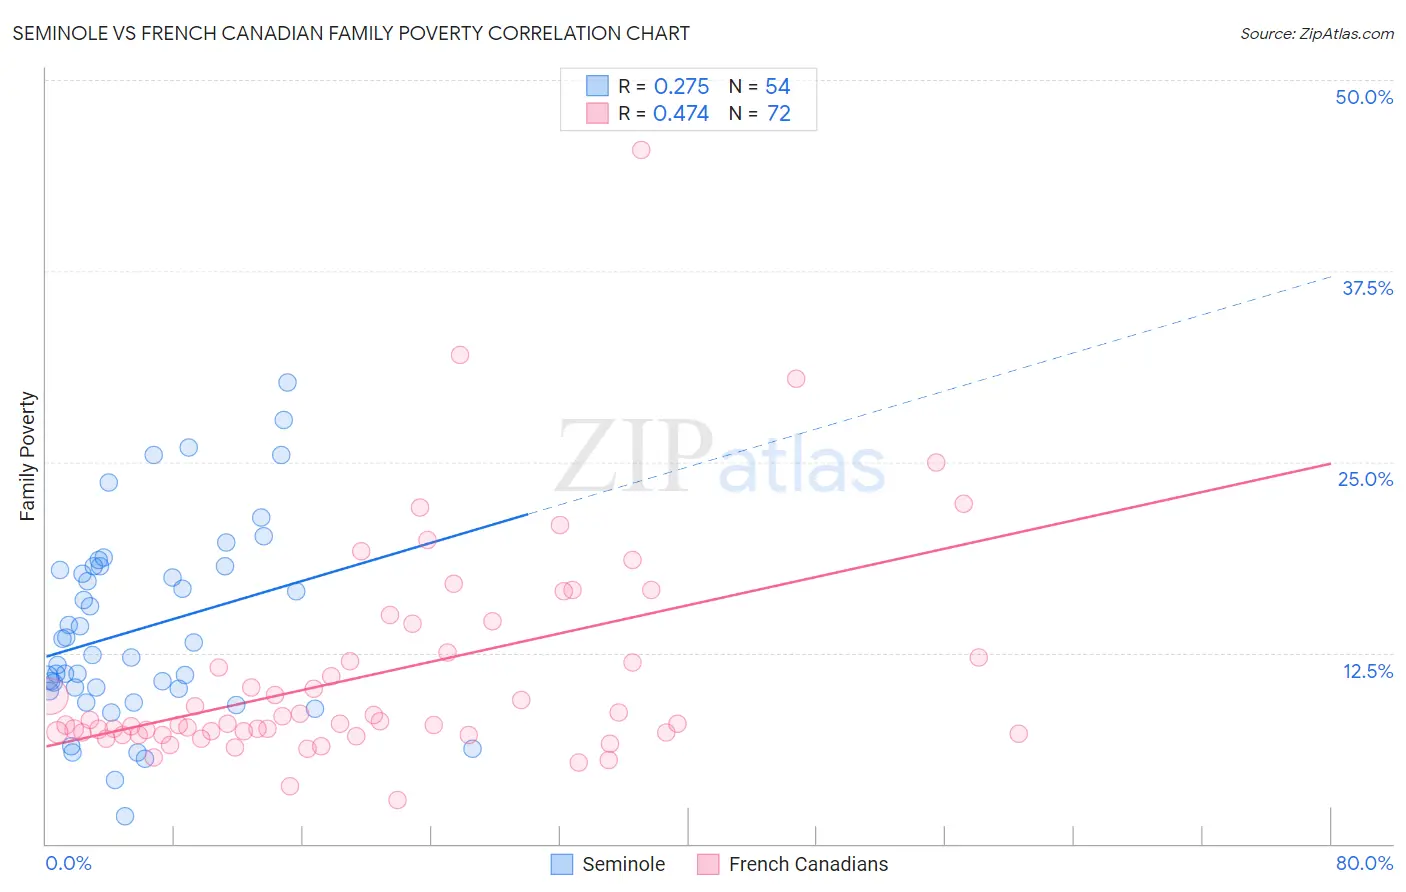
Seminole vs French Canadian Family Poverty Correlation Chart
The statistical analysis conducted on geographies consisting of 118,266,338 people shows a weak positive correlation between the proportion of Seminole and poverty level among families in the United States with a correlation coefficient (R) of 0.275 and weighted average of 11.9%. Similarly, the statistical analysis conducted on geographies consisting of 499,881,871 people shows a moderate positive correlation between the proportion of French Canadians and poverty level among families in the United States with a correlation coefficient (R) of 0.474 and weighted average of 8.1%, a difference of 46.3%.
Family Poverty Correlation Summary
| Measurement | Seminole | French Canadian |
| Minimum | 1.8% | 2.9% |
| Maximum | 30.2% | 45.5% |
| Range | 28.4% | 42.6% |
| Mean | 14.1% | 11.1% |
| Median | 12.7% | 7.9% |
| Interquartile 25% (IQ1) | 10.1% | 7.2% |
| Interquartile 75% (IQ3) | 18.2% | 12.3% |
| Interquartile Range (IQR) | 8.0% | 5.1% |
| Standard Deviation (Sample) | 6.3% | 7.2% |
| Standard Deviation (Population) | 6.2% | 7.1% |
Similar Demographics by Family Poverty
Demographics Similar to Seminole by Family Poverty
In terms of family poverty, the demographic groups most similar to Seminole are Immigrants from Congo (11.9%, a difference of 0.060%), Cajun (11.9%, a difference of 0.17%), Hispanic or Latino (12.0%, a difference of 0.45%), Immigrants from Guatemala (12.0%, a difference of 0.45%), and Mexican (11.8%, a difference of 0.73%).
| Demographics | Rating | Rank | Family Poverty |
| Bahamians | 0.0 /100 | #301 | Tragic 11.7% |
| Guatemalans | 0.0 /100 | #302 | Tragic 11.7% |
| Africans | 0.0 /100 | #303 | Tragic 11.8% |
| Immigrants | Latin America | 0.0 /100 | #304 | Tragic 11.8% |
| Mexicans | 0.0 /100 | #305 | Tragic 11.8% |
| Cajuns | 0.0 /100 | #306 | Tragic 11.9% |
| Immigrants | Congo | 0.0 /100 | #307 | Tragic 11.9% |
| Seminole | 0.0 /100 | #308 | Tragic 11.9% |
| Hispanics or Latinos | 0.0 /100 | #309 | Tragic 12.0% |
| Immigrants | Guatemala | 0.0 /100 | #310 | Tragic 12.0% |
| Ute | 0.0 /100 | #311 | Tragic 12.1% |
| Immigrants | Central America | 0.0 /100 | #312 | Tragic 12.1% |
| Immigrants | Caribbean | 0.0 /100 | #313 | Tragic 12.2% |
| Kiowa | 0.0 /100 | #314 | Tragic 12.2% |
| Immigrants | Mexico | 0.0 /100 | #315 | Tragic 12.3% |
Demographics Similar to French Canadians by Family Poverty
In terms of family poverty, the demographic groups most similar to French Canadians are Egyptian (8.1%, a difference of 0.040%), Basque (8.1%, a difference of 0.090%), Jordanian (8.2%, a difference of 0.18%), Romanian (8.2%, a difference of 0.27%), and Taiwanese (8.2%, a difference of 0.32%).
| Demographics | Rating | Rank | Family Poverty |
| New Zealanders | 95.8 /100 | #100 | Exceptional 8.1% |
| Immigrants | Norway | 95.7 /100 | #101 | Exceptional 8.1% |
| Immigrants | Indonesia | 95.7 /100 | #102 | Exceptional 8.1% |
| Immigrants | Eastern Europe | 95.6 /100 | #103 | Exceptional 8.1% |
| Slavs | 95.6 /100 | #104 | Exceptional 8.1% |
| Laotians | 95.6 /100 | #105 | Exceptional 8.1% |
| Egyptians | 95.1 /100 | #106 | Exceptional 8.1% |
| French Canadians | 95.0 /100 | #107 | Exceptional 8.1% |
| Basques | 94.9 /100 | #108 | Exceptional 8.1% |
| Jordanians | 94.8 /100 | #109 | Exceptional 8.2% |
| Romanians | 94.7 /100 | #110 | Exceptional 8.2% |
| Taiwanese | 94.6 /100 | #111 | Exceptional 8.2% |
| Immigrants | France | 94.4 /100 | #112 | Exceptional 8.2% |
| Canadians | 94.2 /100 | #113 | Exceptional 8.2% |
| Immigrants | Zimbabwe | 94.0 /100 | #114 | Exceptional 8.2% |