Tongan vs Immigrants from Zimbabwe Single Female Poverty
COMPARE
Tongan
Immigrants from Zimbabwe
Single Female Poverty
Single Female Poverty Comparison
Tongans
Immigrants from Zimbabwe
18.8%
SINGLE FEMALE POVERTY
99.9/ 100
METRIC RATING
38th/ 347
METRIC RANK
20.0%
SINGLE FEMALE POVERTY
95.9/ 100
METRIC RATING
113th/ 347
METRIC RANK
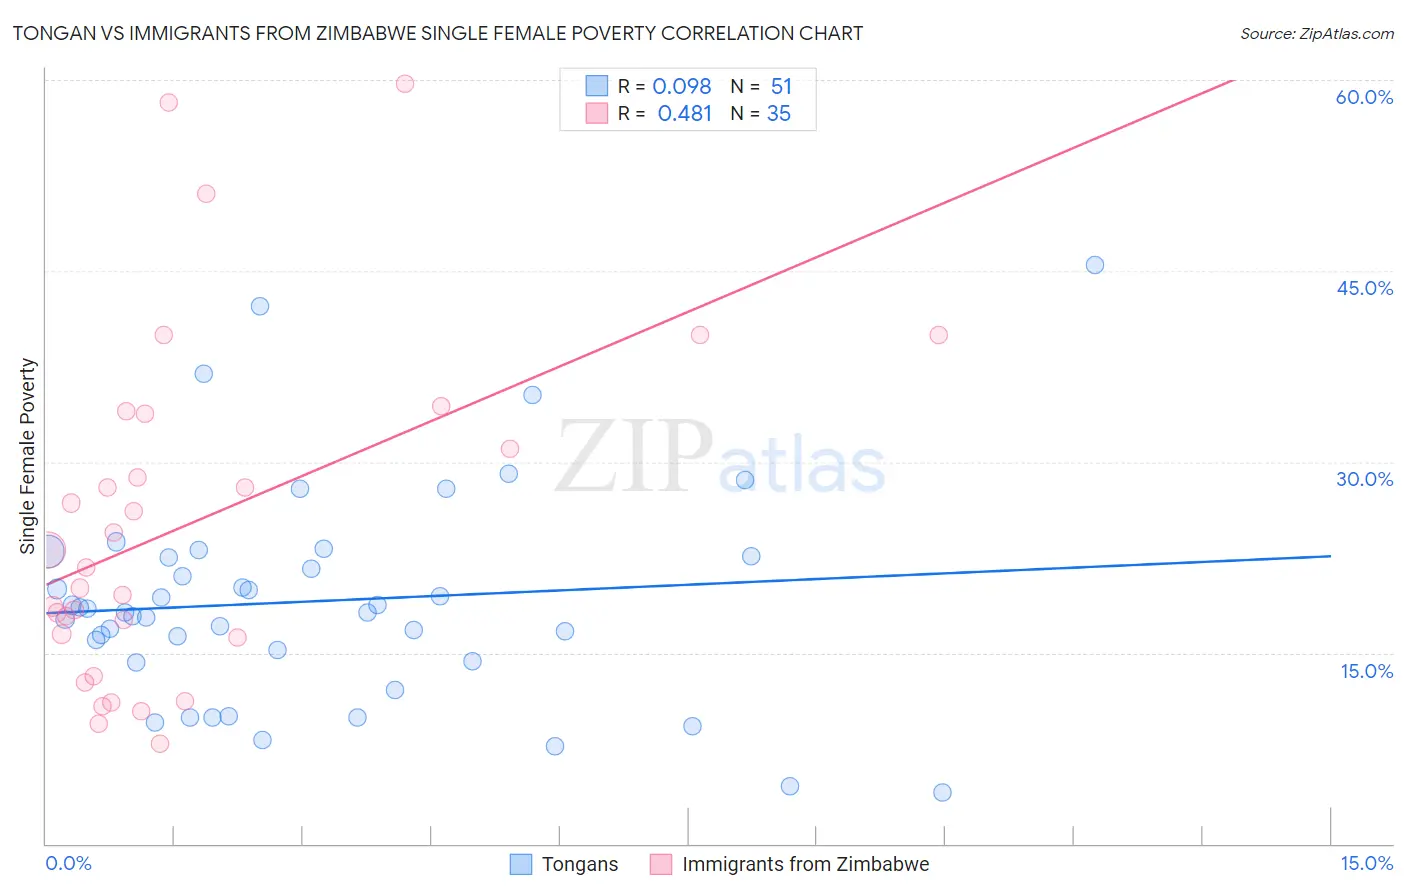
Tongan vs Immigrants from Zimbabwe Single Female Poverty Correlation Chart
The statistical analysis conducted on geographies consisting of 102,377,778 people shows a slight positive correlation between the proportion of Tongans and poverty level among single females in the United States with a correlation coefficient (R) of 0.098 and weighted average of 18.8%. Similarly, the statistical analysis conducted on geographies consisting of 117,320,666 people shows a moderate positive correlation between the proportion of Immigrants from Zimbabwe and poverty level among single females in the United States with a correlation coefficient (R) of 0.481 and weighted average of 20.0%, a difference of 6.4%.
Single Female Poverty Correlation Summary
| Measurement | Tongan | Immigrants from Zimbabwe |
| Minimum | 4.0% | 7.9% |
| Maximum | 45.5% | 59.7% |
| Range | 41.5% | 51.9% |
| Mean | 19.1% | 25.1% |
| Median | 18.2% | 21.7% |
| Interquartile 25% (IQ1) | 14.3% | 16.2% |
| Interquartile 75% (IQ3) | 22.6% | 33.7% |
| Interquartile Range (IQR) | 8.2% | 17.6% |
| Standard Deviation (Sample) | 8.5% | 13.4% |
| Standard Deviation (Population) | 8.4% | 13.2% |
Similar Demographics by Single Female Poverty
Demographics Similar to Tongans by Single Female Poverty
In terms of single female poverty, the demographic groups most similar to Tongans are Bulgarian (18.8%, a difference of 0.030%), Okinawan (18.8%, a difference of 0.060%), Immigrants from Serbia (18.8%, a difference of 0.080%), Jordanian (18.8%, a difference of 0.16%), and Immigrants from Romania (18.8%, a difference of 0.31%).
| Demographics | Rating | Rank | Single Female Poverty |
| Immigrants | Asia | 99.9 /100 | #31 | Exceptional 18.6% |
| Immigrants | Sri Lanka | 99.9 /100 | #32 | Exceptional 18.6% |
| Immigrants | Philippines | 99.9 /100 | #33 | Exceptional 18.6% |
| Koreans | 99.9 /100 | #34 | Exceptional 18.6% |
| Immigrants | Japan | 99.9 /100 | #35 | Exceptional 18.6% |
| Turks | 99.9 /100 | #36 | Exceptional 18.7% |
| Immigrants | Armenia | 99.9 /100 | #37 | Exceptional 18.7% |
| Tongans | 99.9 /100 | #38 | Exceptional 18.8% |
| Bulgarians | 99.9 /100 | #39 | Exceptional 18.8% |
| Okinawans | 99.9 /100 | #40 | Exceptional 18.8% |
| Immigrants | Serbia | 99.9 /100 | #41 | Exceptional 18.8% |
| Jordanians | 99.9 /100 | #42 | Exceptional 18.8% |
| Immigrants | Romania | 99.9 /100 | #43 | Exceptional 18.8% |
| Immigrants | Croatia | 99.9 /100 | #44 | Exceptional 18.9% |
| Immigrants | Indonesia | 99.8 /100 | #45 | Exceptional 18.9% |
Demographics Similar to Immigrants from Zimbabwe by Single Female Poverty
In terms of single female poverty, the demographic groups most similar to Immigrants from Zimbabwe are Immigrants from Colombia (20.0%, a difference of 0.0%), Immigrants from Northern Africa (20.0%, a difference of 0.020%), Immigrants from Netherlands (20.0%, a difference of 0.050%), Immigrants from Kazakhstan (20.0%, a difference of 0.060%), and Polish (20.0%, a difference of 0.10%).
| Demographics | Rating | Rank | Single Female Poverty |
| Ethiopians | 96.7 /100 | #106 | Exceptional 19.9% |
| Immigrants | Syria | 96.7 /100 | #107 | Exceptional 19.9% |
| Native Hawaiians | 96.6 /100 | #108 | Exceptional 19.9% |
| Colombians | 96.6 /100 | #109 | Exceptional 19.9% |
| Immigrants | Western Asia | 96.5 /100 | #110 | Exceptional 19.9% |
| Carpatho Rusyns | 96.1 /100 | #111 | Exceptional 20.0% |
| Immigrants | Netherlands | 96.0 /100 | #112 | Exceptional 20.0% |
| Immigrants | Zimbabwe | 95.9 /100 | #113 | Exceptional 20.0% |
| Immigrants | Colombia | 95.9 /100 | #114 | Exceptional 20.0% |
| Immigrants | Northern Africa | 95.8 /100 | #115 | Exceptional 20.0% |
| Immigrants | Kazakhstan | 95.7 /100 | #116 | Exceptional 20.0% |
| Poles | 95.6 /100 | #117 | Exceptional 20.0% |
| Immigrants | Afghanistan | 95.4 /100 | #118 | Exceptional 20.0% |
| Immigrants | Ethiopia | 95.4 /100 | #119 | Exceptional 20.0% |
| South Americans | 95.1 /100 | #120 | Exceptional 20.0% |