Dominican vs Immigrants from Zimbabwe Per Capita Income
COMPARE
Dominican
Immigrants from Zimbabwe
Per Capita Income
Per Capita Income Comparison
Dominicans
Immigrants from Zimbabwe
$37,697
PER CAPITA INCOME
0.1/ 100
METRIC RATING
287th/ 347
METRIC RANK
$47,394
PER CAPITA INCOME
98.5/ 100
METRIC RATING
93rd/ 347
METRIC RANK
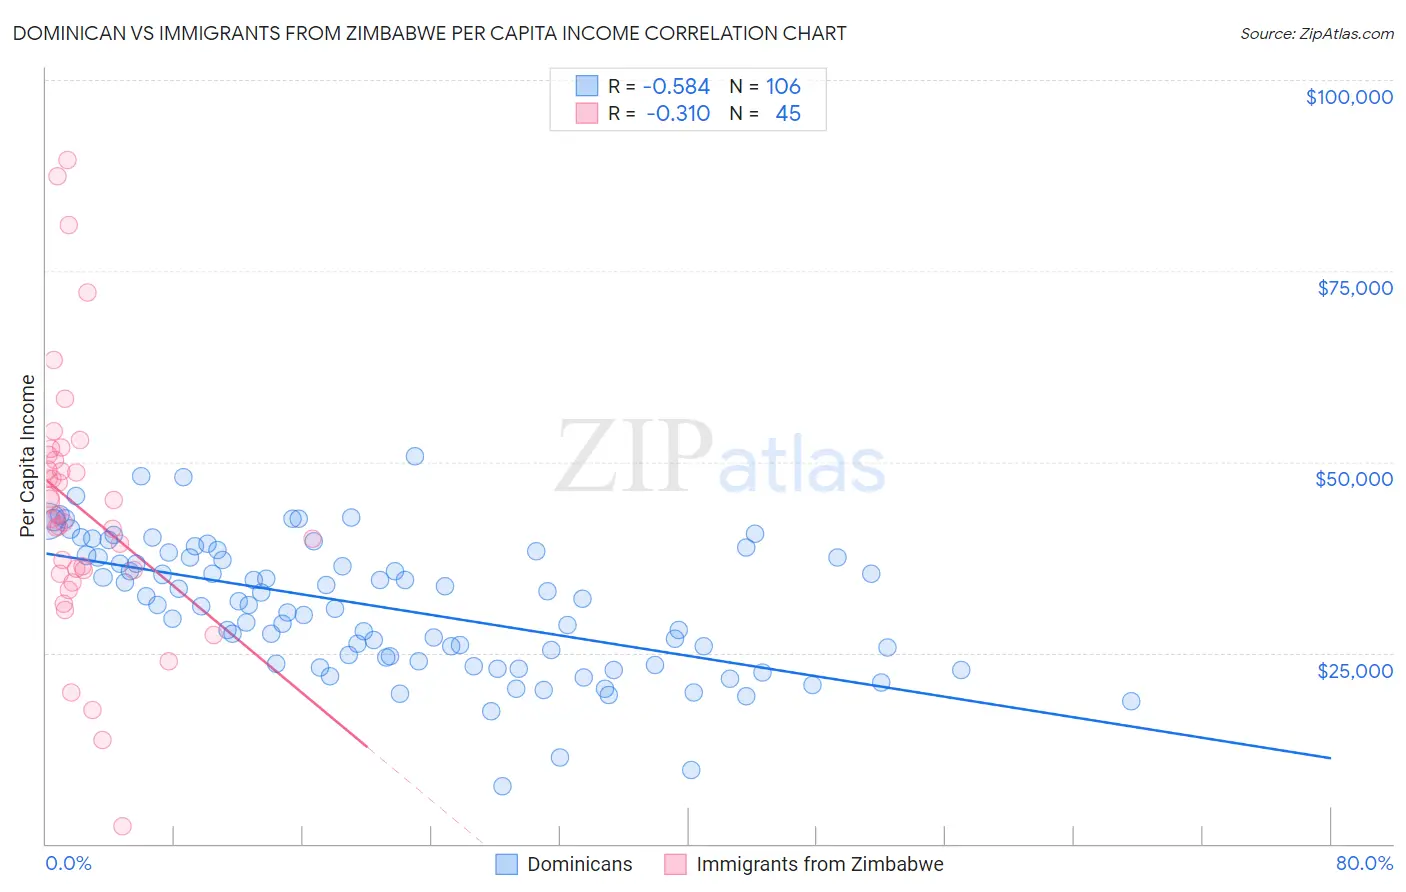
Dominican vs Immigrants from Zimbabwe Per Capita Income Correlation Chart
The statistical analysis conducted on geographies consisting of 355,170,092 people shows a substantial negative correlation between the proportion of Dominicans and per capita income in the United States with a correlation coefficient (R) of -0.584 and weighted average of $37,697. Similarly, the statistical analysis conducted on geographies consisting of 117,813,757 people shows a mild negative correlation between the proportion of Immigrants from Zimbabwe and per capita income in the United States with a correlation coefficient (R) of -0.310 and weighted average of $47,394, a difference of 25.7%.
Per Capita Income Correlation Summary
| Measurement | Dominican | Immigrants from Zimbabwe |
| Minimum | $7,474 | $2,302 |
| Maximum | $50,766 | $89,578 |
| Range | $43,292 | $87,276 |
| Mean | $30,940 | $43,763 |
| Median | $31,292 | $42,560 |
| Interquartile 25% (IQ1) | $23,892 | $35,574 |
| Interquartile 75% (IQ3) | $37,544 | $50,554 |
| Interquartile Range (IQR) | $13,652 | $14,981 |
| Standard Deviation (Sample) | $8,599 | $17,068 |
| Standard Deviation (Population) | $8,559 | $16,878 |
Similar Demographics by Per Capita Income
Demographics Similar to Dominicans by Per Capita Income
In terms of per capita income, the demographic groups most similar to Dominicans are Blackfeet ($37,695, a difference of 0.0%), Central American Indian ($37,699, a difference of 0.010%), Guatemalan ($37,766, a difference of 0.19%), African ($37,785, a difference of 0.24%), and U.S. Virgin Islander ($37,589, a difference of 0.29%).
| Demographics | Rating | Rank | Per Capita Income |
| Potawatomi | 0.2 /100 | #280 | Tragic $38,046 |
| Immigrants | Dominica | 0.2 /100 | #281 | Tragic $37,952 |
| Immigrants | Laos | 0.1 /100 | #282 | Tragic $37,857 |
| Pennsylvania Germans | 0.1 /100 | #283 | Tragic $37,842 |
| Africans | 0.1 /100 | #284 | Tragic $37,785 |
| Guatemalans | 0.1 /100 | #285 | Tragic $37,766 |
| Central American Indians | 0.1 /100 | #286 | Tragic $37,699 |
| Dominicans | 0.1 /100 | #287 | Tragic $37,697 |
| Blackfeet | 0.1 /100 | #288 | Tragic $37,695 |
| U.S. Virgin Islanders | 0.1 /100 | #289 | Tragic $37,589 |
| Immigrants | Guatemala | 0.1 /100 | #290 | Tragic $37,550 |
| Cajuns | 0.1 /100 | #291 | Tragic $37,527 |
| Immigrants | Micronesia | 0.1 /100 | #292 | Tragic $37,464 |
| Mexican American Indians | 0.1 /100 | #293 | Tragic $37,407 |
| Cubans | 0.1 /100 | #294 | Tragic $37,383 |
Demographics Similar to Immigrants from Zimbabwe by Per Capita Income
In terms of per capita income, the demographic groups most similar to Immigrants from Zimbabwe are Albanian ($47,379, a difference of 0.030%), Immigrants from Egypt ($47,361, a difference of 0.070%), Immigrants from Moldova ($47,489, a difference of 0.20%), Alsatian ($47,284, a difference of 0.23%), and Carpatho Rusyn ($47,248, a difference of 0.31%).
| Demographics | Rating | Rank | Per Capita Income |
| Immigrants | Southern Europe | 99.3 /100 | #86 | Exceptional $48,027 |
| Ukrainians | 99.3 /100 | #87 | Exceptional $48,014 |
| Croatians | 99.0 /100 | #88 | Exceptional $47,742 |
| Northern Europeans | 98.9 /100 | #89 | Exceptional $47,698 |
| Italians | 98.8 /100 | #90 | Exceptional $47,574 |
| Macedonians | 98.8 /100 | #91 | Exceptional $47,573 |
| Immigrants | Moldova | 98.7 /100 | #92 | Exceptional $47,489 |
| Immigrants | Zimbabwe | 98.5 /100 | #93 | Exceptional $47,394 |
| Albanians | 98.5 /100 | #94 | Exceptional $47,379 |
| Immigrants | Egypt | 98.5 /100 | #95 | Exceptional $47,361 |
| Alsatians | 98.3 /100 | #96 | Exceptional $47,284 |
| Carpatho Rusyns | 98.2 /100 | #97 | Exceptional $47,248 |
| Immigrants | Pakistan | 97.9 /100 | #98 | Exceptional $47,084 |
| Laotians | 97.8 /100 | #99 | Exceptional $47,041 |
| Immigrants | Lebanon | 97.5 /100 | #100 | Exceptional $46,938 |