Scandinavian vs Immigrants from Zimbabwe Single Female Poverty
COMPARE
Scandinavian
Immigrants from Zimbabwe
Single Female Poverty
Single Female Poverty Comparison
Scandinavians
Immigrants from Zimbabwe
21.1%
SINGLE FEMALE POVERTY
45.2/ 100
METRIC RATING
177th/ 347
METRIC RANK
20.0%
SINGLE FEMALE POVERTY
95.9/ 100
METRIC RATING
113th/ 347
METRIC RANK
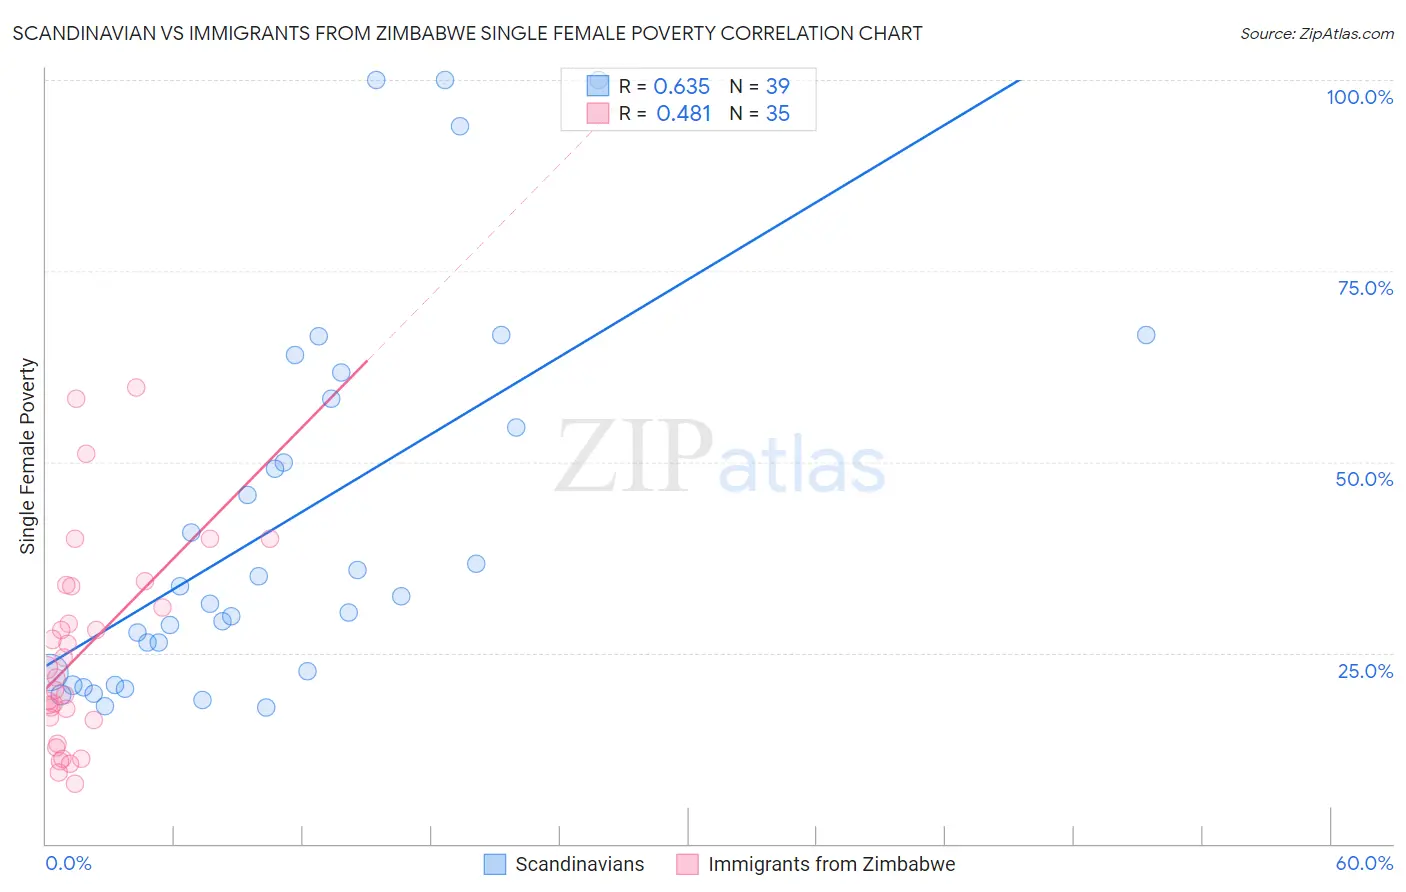
Scandinavian vs Immigrants from Zimbabwe Single Female Poverty Correlation Chart
The statistical analysis conducted on geographies consisting of 461,288,786 people shows a significant positive correlation between the proportion of Scandinavians and poverty level among single females in the United States with a correlation coefficient (R) of 0.635 and weighted average of 21.1%. Similarly, the statistical analysis conducted on geographies consisting of 117,320,666 people shows a moderate positive correlation between the proportion of Immigrants from Zimbabwe and poverty level among single females in the United States with a correlation coefficient (R) of 0.481 and weighted average of 20.0%, a difference of 5.5%.
Single Female Poverty Correlation Summary
| Measurement | Scandinavian | Immigrants from Zimbabwe |
| Minimum | 17.8% | 7.9% |
| Maximum | 100.0% | 59.7% |
| Range | 82.2% | 51.9% |
| Mean | 42.1% | 25.1% |
| Median | 32.4% | 21.7% |
| Interquartile 25% (IQ1) | 22.3% | 16.2% |
| Interquartile 75% (IQ3) | 58.3% | 33.7% |
| Interquartile Range (IQR) | 36.0% | 17.6% |
| Standard Deviation (Sample) | 24.6% | 13.4% |
| Standard Deviation (Population) | 24.3% | 13.2% |
Similar Demographics by Single Female Poverty
Demographics Similar to Scandinavians by Single Female Poverty
In terms of single female poverty, the demographic groups most similar to Scandinavians are Canadian (21.1%, a difference of 0.010%), Immigrants from Bosnia and Herzegovina (21.1%, a difference of 0.020%), Czech (21.0%, a difference of 0.10%), British (21.1%, a difference of 0.14%), and Spanish American Indian (21.1%, a difference of 0.17%).
| Demographics | Rating | Rank | Single Female Poverty |
| New Zealanders | 53.2 /100 | #170 | Average 21.0% |
| Moroccans | 52.8 /100 | #171 | Average 21.0% |
| Guyanese | 52.0 /100 | #172 | Average 21.0% |
| Immigrants | Guyana | 50.6 /100 | #173 | Average 21.0% |
| Cubans | 50.0 /100 | #174 | Average 21.0% |
| Czechs | 46.8 /100 | #175 | Average 21.0% |
| Canadians | 45.4 /100 | #176 | Average 21.1% |
| Scandinavians | 45.2 /100 | #177 | Average 21.1% |
| Immigrants | Bosnia and Herzegovina | 44.9 /100 | #178 | Average 21.1% |
| British | 42.9 /100 | #179 | Average 21.1% |
| Spanish American Indians | 42.5 /100 | #180 | Average 21.1% |
| Europeans | 42.3 /100 | #181 | Average 21.1% |
| Slavs | 40.5 /100 | #182 | Average 21.1% |
| Slovaks | 39.7 /100 | #183 | Fair 21.1% |
| Hungarians | 39.6 /100 | #184 | Fair 21.1% |
Demographics Similar to Immigrants from Zimbabwe by Single Female Poverty
In terms of single female poverty, the demographic groups most similar to Immigrants from Zimbabwe are Immigrants from Colombia (20.0%, a difference of 0.0%), Immigrants from Northern Africa (20.0%, a difference of 0.020%), Immigrants from Netherlands (20.0%, a difference of 0.050%), Immigrants from Kazakhstan (20.0%, a difference of 0.060%), and Polish (20.0%, a difference of 0.10%).
| Demographics | Rating | Rank | Single Female Poverty |
| Ethiopians | 96.7 /100 | #106 | Exceptional 19.9% |
| Immigrants | Syria | 96.7 /100 | #107 | Exceptional 19.9% |
| Native Hawaiians | 96.6 /100 | #108 | Exceptional 19.9% |
| Colombians | 96.6 /100 | #109 | Exceptional 19.9% |
| Immigrants | Western Asia | 96.5 /100 | #110 | Exceptional 19.9% |
| Carpatho Rusyns | 96.1 /100 | #111 | Exceptional 20.0% |
| Immigrants | Netherlands | 96.0 /100 | #112 | Exceptional 20.0% |
| Immigrants | Zimbabwe | 95.9 /100 | #113 | Exceptional 20.0% |
| Immigrants | Colombia | 95.9 /100 | #114 | Exceptional 20.0% |
| Immigrants | Northern Africa | 95.8 /100 | #115 | Exceptional 20.0% |
| Immigrants | Kazakhstan | 95.7 /100 | #116 | Exceptional 20.0% |
| Poles | 95.6 /100 | #117 | Exceptional 20.0% |
| Immigrants | Afghanistan | 95.4 /100 | #118 | Exceptional 20.0% |
| Immigrants | Ethiopia | 95.4 /100 | #119 | Exceptional 20.0% |
| South Americans | 95.1 /100 | #120 | Exceptional 20.0% |