Immigrants from Belarus vs Celtic Married-Couple Family Poverty
COMPARE
Immigrants from Belarus
Celtic
Married-Couple Family Poverty
Married-Couple Family Poverty Comparison
Immigrants from Belarus
Celtics
5.4%
MARRIED-COUPLE FAMILY POVERTY
26.2/ 100
METRIC RATING
198th/ 347
METRIC RANK
4.8%
MARRIED-COUPLE FAMILY POVERTY
94.8/ 100
METRIC RATING
116th/ 347
METRIC RANK
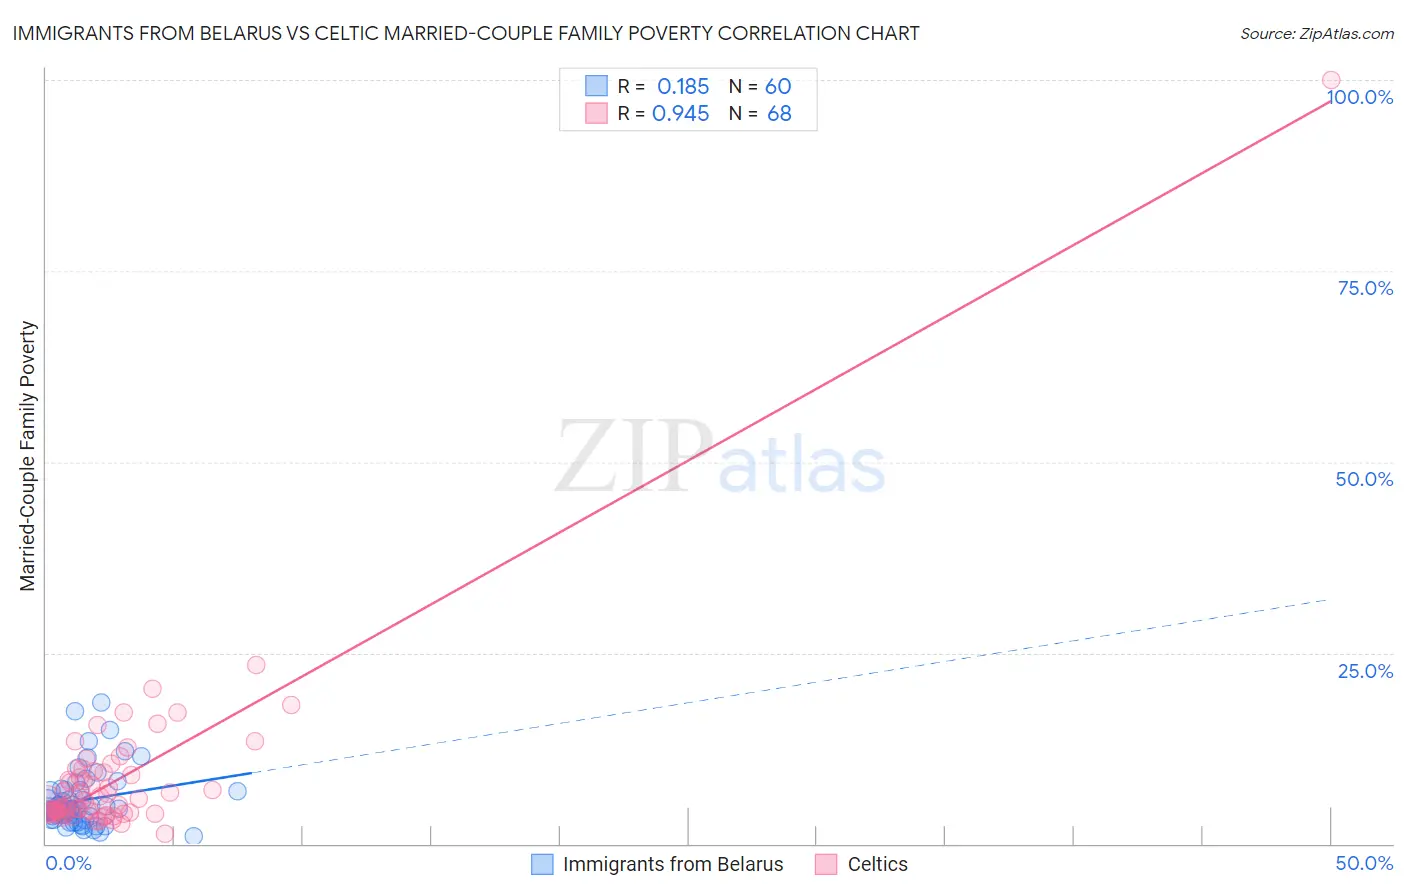
Immigrants from Belarus vs Celtic Married-Couple Family Poverty Correlation Chart
The statistical analysis conducted on geographies consisting of 149,577,130 people shows a poor positive correlation between the proportion of Immigrants from Belarus and poverty level among married-couple families in the United States with a correlation coefficient (R) of 0.185 and weighted average of 5.4%. Similarly, the statistical analysis conducted on geographies consisting of 167,973,280 people shows a near-perfect positive correlation between the proportion of Celtics and poverty level among married-couple families in the United States with a correlation coefficient (R) of 0.945 and weighted average of 4.8%, a difference of 12.5%.
Married-Couple Family Poverty Correlation Summary
| Measurement | Immigrants from Belarus | Celtic |
| Minimum | 1.0% | 1.3% |
| Maximum | 18.5% | 100.0% |
| Range | 17.5% | 98.7% |
| Mean | 5.7% | 8.7% |
| Median | 4.6% | 5.4% |
| Interquartile 25% (IQ1) | 3.4% | 4.1% |
| Interquartile 75% (IQ3) | 7.0% | 9.4% |
| Interquartile Range (IQR) | 3.6% | 5.4% |
| Standard Deviation (Sample) | 3.7% | 12.2% |
| Standard Deviation (Population) | 3.7% | 12.1% |
Similar Demographics by Married-Couple Family Poverty
Demographics Similar to Immigrants from Belarus by Married-Couple Family Poverty
In terms of married-couple family poverty, the demographic groups most similar to Immigrants from Belarus are Liberian (5.4%, a difference of 0.020%), Spaniard (5.4%, a difference of 0.18%), Uruguayan (5.4%, a difference of 0.18%), Immigrants from the Azores (5.4%, a difference of 0.20%), and Immigrants from Israel (5.4%, a difference of 0.24%).
| Demographics | Rating | Rank | Married-Couple Family Poverty |
| Immigrants | Cabo Verde | 30.9 /100 | #191 | Fair 5.3% |
| Cape Verdeans | 30.7 /100 | #192 | Fair 5.3% |
| Malaysians | 29.5 /100 | #193 | Fair 5.4% |
| Immigrants | Israel | 27.8 /100 | #194 | Fair 5.4% |
| Immigrants | Azores | 27.5 /100 | #195 | Fair 5.4% |
| Spaniards | 27.4 /100 | #196 | Fair 5.4% |
| Liberians | 26.3 /100 | #197 | Fair 5.4% |
| Immigrants | Belarus | 26.2 /100 | #198 | Fair 5.4% |
| Uruguayans | 25.0 /100 | #199 | Fair 5.4% |
| Immigrants | Morocco | 24.3 /100 | #200 | Fair 5.4% |
| Lebanese | 24.1 /100 | #201 | Fair 5.4% |
| Immigrants | Middle Africa | 23.8 /100 | #202 | Fair 5.4% |
| Immigrants | Peru | 21.8 /100 | #203 | Fair 5.4% |
| Immigrants | Costa Rica | 19.4 /100 | #204 | Poor 5.4% |
| Chippewa | 18.9 /100 | #205 | Poor 5.4% |
Demographics Similar to Celtics by Married-Couple Family Poverty
In terms of married-couple family poverty, the demographic groups most similar to Celtics are Taiwanese (4.8%, a difference of 0.010%), Kenyan (4.8%, a difference of 0.10%), Immigrants from Philippines (4.8%, a difference of 0.12%), Immigrants from Indonesia (4.8%, a difference of 0.16%), and Immigrants from Eastern Asia (4.8%, a difference of 0.48%).
| Demographics | Rating | Rank | Married-Couple Family Poverty |
| Immigrants | Hong Kong | 96.4 /100 | #109 | Exceptional 4.7% |
| Immigrants | Bolivia | 96.2 /100 | #110 | Exceptional 4.7% |
| Pakistanis | 96.2 /100 | #111 | Exceptional 4.7% |
| Tongans | 95.9 /100 | #112 | Exceptional 4.7% |
| Immigrants | Nepal | 95.9 /100 | #113 | Exceptional 4.7% |
| Immigrants | Indonesia | 95.1 /100 | #114 | Exceptional 4.8% |
| Taiwanese | 94.8 /100 | #115 | Exceptional 4.8% |
| Celtics | 94.8 /100 | #116 | Exceptional 4.8% |
| Kenyans | 94.7 /100 | #117 | Exceptional 4.8% |
| Immigrants | Philippines | 94.6 /100 | #118 | Exceptional 4.8% |
| Immigrants | Eastern Asia | 94.0 /100 | #119 | Exceptional 4.8% |
| Immigrants | Southern Europe | 93.4 /100 | #120 | Exceptional 4.8% |
| Indians (Asian) | 93.2 /100 | #121 | Exceptional 4.8% |
| Whites/Caucasians | 93.1 /100 | #122 | Exceptional 4.8% |
| Jordanians | 93.1 /100 | #123 | Exceptional 4.8% |