Delaware vs Celtic GED/Equivalency
COMPARE
Delaware
Celtic
GED/Equivalency
GED/Equivalency Comparison
Delaware
Celtics
85.2%
GED/EQUIVALENCY
22.2/ 100
METRIC RATING
193rd/ 347
METRIC RANK
86.7%
GED/EQUIVALENCY
90.4/ 100
METRIC RATING
125th/ 347
METRIC RANK
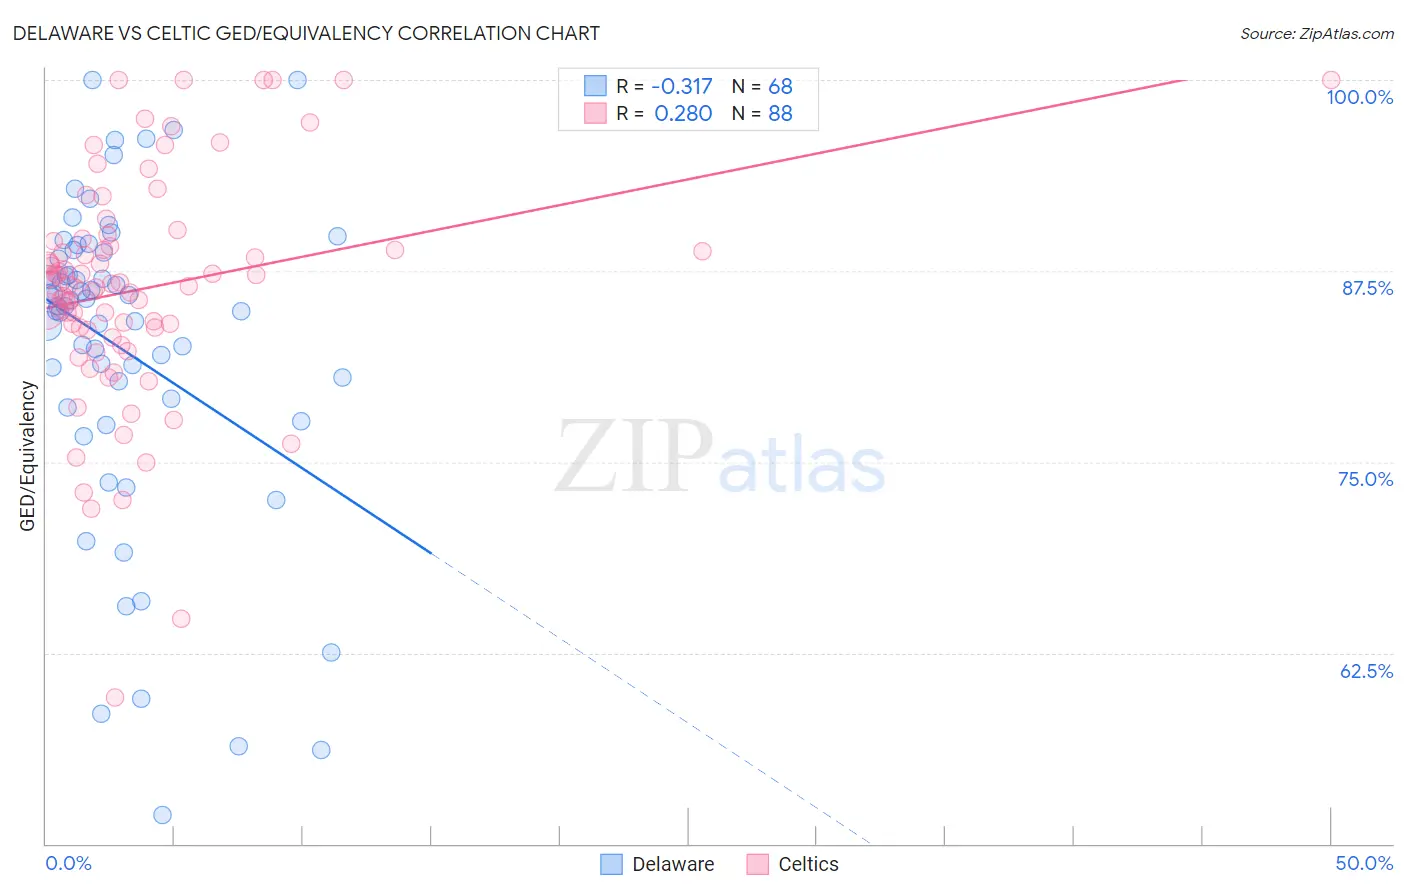
Delaware vs Celtic GED/Equivalency Correlation Chart
The statistical analysis conducted on geographies consisting of 96,235,398 people shows a mild negative correlation between the proportion of Delaware and percentage of population with at least ged/equivalency education in the United States with a correlation coefficient (R) of -0.317 and weighted average of 85.2%. Similarly, the statistical analysis conducted on geographies consisting of 168,876,981 people shows a weak positive correlation between the proportion of Celtics and percentage of population with at least ged/equivalency education in the United States with a correlation coefficient (R) of 0.280 and weighted average of 86.7%, a difference of 1.8%.
GED/Equivalency Correlation Summary
| Measurement | Delaware | Celtic |
| Minimum | 51.9% | 59.6% |
| Maximum | 100.0% | 100.0% |
| Range | 48.1% | 40.4% |
| Mean | 82.3% | 86.4% |
| Median | 85.2% | 86.5% |
| Interquartile 25% (IQ1) | 78.8% | 83.7% |
| Interquartile 75% (IQ3) | 88.5% | 89.3% |
| Interquartile Range (IQR) | 9.7% | 5.6% |
| Standard Deviation (Sample) | 10.5% | 7.4% |
| Standard Deviation (Population) | 10.5% | 7.4% |
Similar Demographics by GED/Equivalency
Demographics Similar to Delaware by GED/Equivalency
In terms of ged/equivalency, the demographic groups most similar to Delaware are Nonimmigrants (85.2%, a difference of 0.010%), South American Indian (85.2%, a difference of 0.020%), Puget Sound Salish (85.2%, a difference of 0.040%), Chippewa (85.2%, a difference of 0.040%), and Tongan (85.2%, a difference of 0.050%).
| Demographics | Rating | Rank | GED/Equivalency |
| Spaniards | 31.9 /100 | #186 | Fair 85.4% |
| Immigrants | Afghanistan | 29.8 /100 | #187 | Fair 85.4% |
| Immigrants | Sierra Leone | 29.0 /100 | #188 | Fair 85.4% |
| Guamanians/Chamorros | 28.4 /100 | #189 | Fair 85.3% |
| Alaskan Athabascans | 27.5 /100 | #190 | Fair 85.3% |
| South American Indians | 22.8 /100 | #191 | Fair 85.2% |
| Immigrants | Nonimmigrants | 22.7 /100 | #192 | Fair 85.2% |
| Delaware | 22.2 /100 | #193 | Fair 85.2% |
| Puget Sound Salish | 20.8 /100 | #194 | Fair 85.2% |
| Chippewa | 20.8 /100 | #195 | Fair 85.2% |
| Tongans | 20.7 /100 | #196 | Fair 85.2% |
| Costa Ricans | 20.4 /100 | #197 | Fair 85.2% |
| Immigrants | Africa | 17.5 /100 | #198 | Poor 85.1% |
| Somalis | 16.4 /100 | #199 | Poor 85.0% |
| Uruguayans | 16.0 /100 | #200 | Poor 85.0% |
Demographics Similar to Celtics by GED/Equivalency
In terms of ged/equivalency, the demographic groups most similar to Celtics are Immigrants from Egypt (86.7%, a difference of 0.0%), Immigrants from Italy (86.7%, a difference of 0.010%), Asian (86.7%, a difference of 0.010%), Immigrants from Lebanon (86.8%, a difference of 0.030%), and Immigrants from Jordan (86.8%, a difference of 0.030%).
| Demographics | Rating | Rank | GED/Equivalency |
| French Canadians | 93.2 /100 | #118 | Exceptional 86.9% |
| Immigrants | China | 93.2 /100 | #119 | Exceptional 86.9% |
| Scotch-Irish | 91.6 /100 | #120 | Exceptional 86.8% |
| Immigrants | Lebanon | 90.9 /100 | #121 | Exceptional 86.8% |
| Immigrants | Jordan | 90.8 /100 | #122 | Exceptional 86.8% |
| Immigrants | Italy | 90.5 /100 | #123 | Exceptional 86.7% |
| Immigrants | Egypt | 90.4 /100 | #124 | Exceptional 86.7% |
| Celtics | 90.4 /100 | #125 | Exceptional 86.7% |
| Asians | 90.3 /100 | #126 | Exceptional 86.7% |
| Argentineans | 89.7 /100 | #127 | Excellent 86.7% |
| Yugoslavians | 89.5 /100 | #128 | Excellent 86.7% |
| Immigrants | Ukraine | 88.9 /100 | #129 | Excellent 86.7% |
| Immigrants | Germany | 88.8 /100 | #130 | Excellent 86.7% |
| Immigrants | Spain | 88.5 /100 | #131 | Excellent 86.7% |
| Immigrants | Brazil | 88.4 /100 | #132 | Excellent 86.6% |