Immigrants from Cuba vs Zimbabwean Female Poverty
COMPARE
Immigrants from Cuba
Zimbabwean
Female Poverty
Female Poverty Comparison
Immigrants from Cuba
Zimbabweans
16.1%
FEMALE POVERTY
0.0/ 100
METRIC RATING
283rd/ 347
METRIC RANK
12.3%
FEMALE POVERTY
97.5/ 100
METRIC RATING
73rd/ 347
METRIC RANK
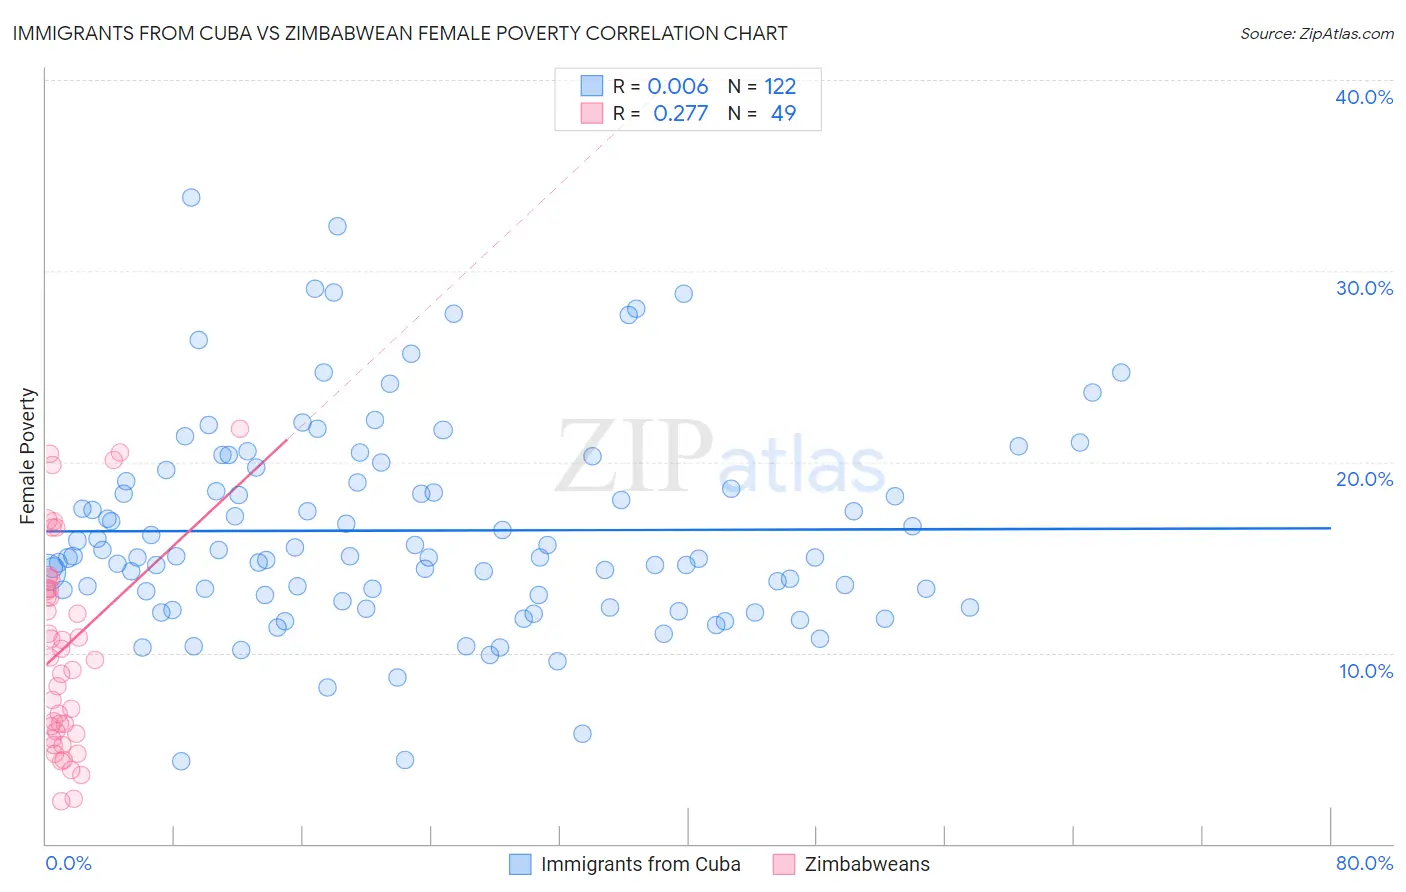
Immigrants from Cuba vs Zimbabwean Female Poverty Correlation Chart
The statistical analysis conducted on geographies consisting of 325,939,480 people shows no correlation between the proportion of Immigrants from Cuba and poverty level among females in the United States with a correlation coefficient (R) of 0.006 and weighted average of 16.1%. Similarly, the statistical analysis conducted on geographies consisting of 69,185,827 people shows a weak positive correlation between the proportion of Zimbabweans and poverty level among females in the United States with a correlation coefficient (R) of 0.277 and weighted average of 12.3%, a difference of 31.8%.
Female Poverty Correlation Summary
| Measurement | Immigrants from Cuba | Zimbabwean |
| Minimum | 4.3% | 2.2% |
| Maximum | 33.8% | 21.7% |
| Range | 29.5% | 19.5% |
| Mean | 16.4% | 10.3% |
| Median | 15.0% | 9.7% |
| Interquartile 25% (IQ1) | 13.0% | 5.8% |
| Interquartile 75% (IQ3) | 19.0% | 13.6% |
| Interquartile Range (IQR) | 6.0% | 7.8% |
| Standard Deviation (Sample) | 5.5% | 5.3% |
| Standard Deviation (Population) | 5.4% | 5.2% |
Similar Demographics by Female Poverty
Demographics Similar to Immigrants from Cuba by Female Poverty
In terms of female poverty, the demographic groups most similar to Immigrants from Cuba are Spanish American (16.2%, a difference of 0.050%), Immigrants from Haiti (16.1%, a difference of 0.080%), Comanche (16.2%, a difference of 0.13%), West Indian (16.1%, a difference of 0.24%), and Vietnamese (16.1%, a difference of 0.26%).
| Demographics | Rating | Rank | Female Poverty |
| Central Americans | 0.0 /100 | #276 | Tragic 16.0% |
| Bangladeshis | 0.0 /100 | #277 | Tragic 16.0% |
| Immigrants | West Indies | 0.0 /100 | #278 | Tragic 16.1% |
| Immigrants | Bahamas | 0.0 /100 | #279 | Tragic 16.1% |
| Vietnamese | 0.0 /100 | #280 | Tragic 16.1% |
| West Indians | 0.0 /100 | #281 | Tragic 16.1% |
| Immigrants | Haiti | 0.0 /100 | #282 | Tragic 16.1% |
| Immigrants | Cuba | 0.0 /100 | #283 | Tragic 16.1% |
| Spanish Americans | 0.0 /100 | #284 | Tragic 16.2% |
| Comanche | 0.0 /100 | #285 | Tragic 16.2% |
| Inupiat | 0.0 /100 | #286 | Tragic 16.2% |
| Immigrants | Belize | 0.0 /100 | #287 | Tragic 16.3% |
| Indonesians | 0.0 /100 | #288 | Tragic 16.4% |
| Blackfeet | 0.0 /100 | #289 | Tragic 16.4% |
| Immigrants | Bangladesh | 0.0 /100 | #290 | Tragic 16.4% |
Demographics Similar to Zimbabweans by Female Poverty
In terms of female poverty, the demographic groups most similar to Zimbabweans are Immigrants from Canada (12.3%, a difference of 0.010%), Cambodian (12.2%, a difference of 0.020%), Carpatho Rusyn (12.2%, a difference of 0.050%), European (12.3%, a difference of 0.13%), and Immigrants from Belgium (12.2%, a difference of 0.18%).
| Demographics | Rating | Rank | Female Poverty |
| Austrians | 97.9 /100 | #66 | Exceptional 12.2% |
| Immigrants | Eastern Asia | 97.8 /100 | #67 | Exceptional 12.2% |
| Immigrants | Netherlands | 97.8 /100 | #68 | Exceptional 12.2% |
| Swiss | 97.7 /100 | #69 | Exceptional 12.2% |
| Immigrants | Belgium | 97.7 /100 | #70 | Exceptional 12.2% |
| Carpatho Rusyns | 97.6 /100 | #71 | Exceptional 12.2% |
| Cambodians | 97.5 /100 | #72 | Exceptional 12.2% |
| Zimbabweans | 97.5 /100 | #73 | Exceptional 12.3% |
| Immigrants | Canada | 97.5 /100 | #74 | Exceptional 12.3% |
| Europeans | 97.4 /100 | #75 | Exceptional 12.3% |
| Immigrants | Eastern Europe | 97.2 /100 | #76 | Exceptional 12.3% |
| Serbians | 97.2 /100 | #77 | Exceptional 12.3% |
| Egyptians | 97.2 /100 | #78 | Exceptional 12.3% |
| Immigrants | North America | 97.1 /100 | #79 | Exceptional 12.3% |
| Slovaks | 97.1 /100 | #80 | Exceptional 12.3% |