Czechoslovakian vs Soviet Union Single Male Poverty
COMPARE
Czechoslovakian
Soviet Union
Single Male Poverty
Single Male Poverty Comparison
Czechoslovakians
Soviet Union
13.4%
SINGLE MALE POVERTY
3.0/ 100
METRIC RATING
239th/ 347
METRIC RANK
11.5%
SINGLE MALE POVERTY
100.0/ 100
METRIC RATING
39th/ 347
METRIC RANK
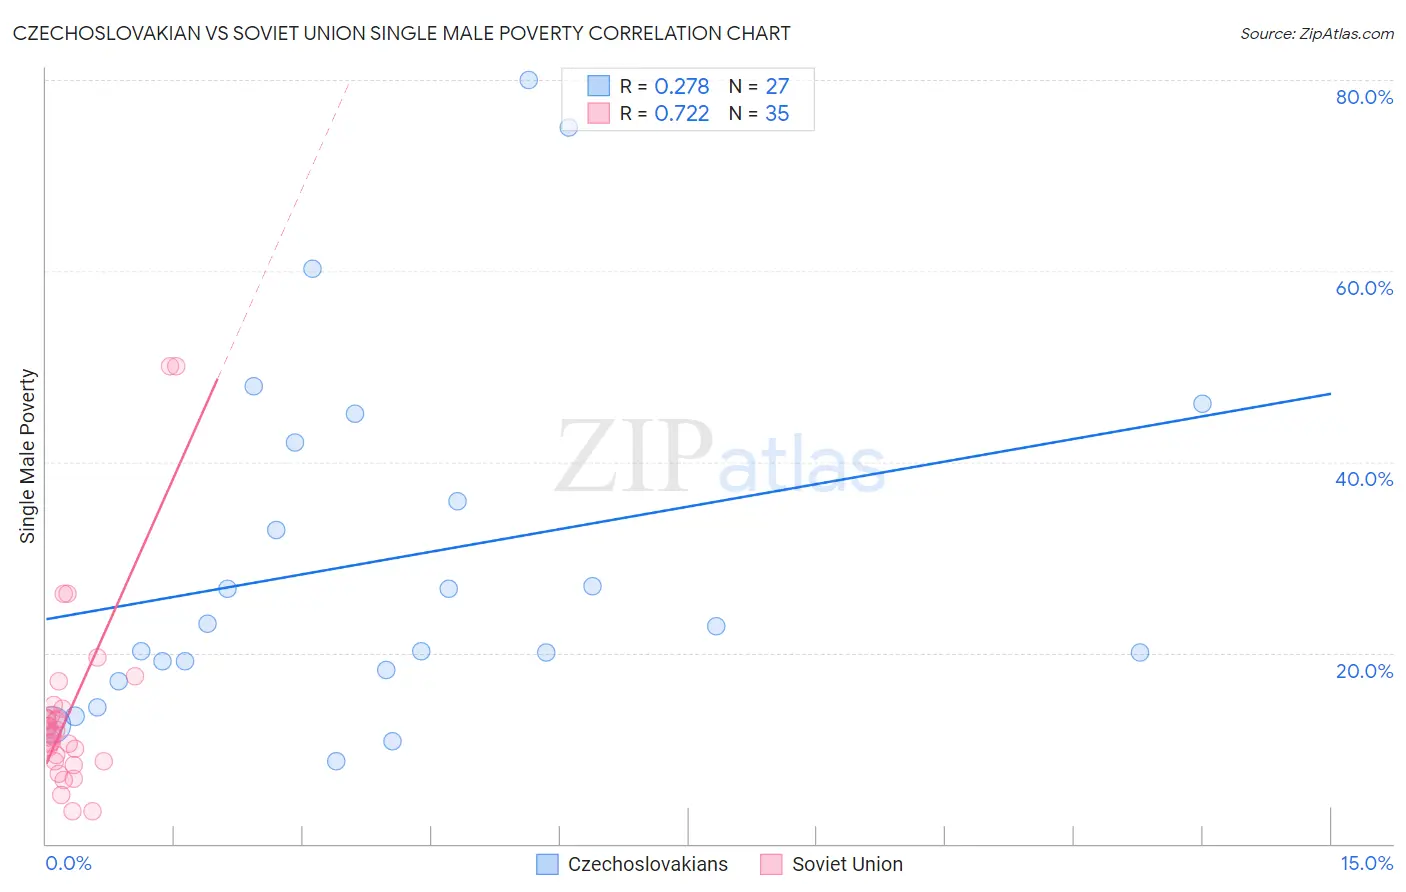
Czechoslovakian vs Soviet Union Single Male Poverty Correlation Chart
The statistical analysis conducted on geographies consisting of 321,828,483 people shows a weak positive correlation between the proportion of Czechoslovakians and poverty level among single males in the United States with a correlation coefficient (R) of 0.278 and weighted average of 13.4%. Similarly, the statistical analysis conducted on geographies consisting of 42,355,679 people shows a strong positive correlation between the proportion of Soviet Union and poverty level among single males in the United States with a correlation coefficient (R) of 0.722 and weighted average of 11.5%, a difference of 16.7%.
Single Male Poverty Correlation Summary
| Measurement | Czechoslovakian | Soviet Union |
| Minimum | 8.6% | 3.3% |
| Maximum | 80.0% | 50.0% |
| Range | 71.4% | 46.7% |
| Mean | 29.8% | 14.0% |
| Median | 22.7% | 11.5% |
| Interquartile 25% (IQ1) | 18.2% | 8.7% |
| Interquartile 75% (IQ3) | 42.1% | 14.1% |
| Interquartile Range (IQR) | 23.9% | 5.4% |
| Standard Deviation (Sample) | 18.8% | 10.3% |
| Standard Deviation (Population) | 18.4% | 10.2% |
Similar Demographics by Single Male Poverty
Demographics Similar to Czechoslovakians by Single Male Poverty
In terms of single male poverty, the demographic groups most similar to Czechoslovakians are Immigrants from Ghana (13.4%, a difference of 0.080%), British West Indian (13.4%, a difference of 0.18%), Luxembourger (13.4%, a difference of 0.24%), Bangladeshi (13.3%, a difference of 0.29%), and Belizean (13.4%, a difference of 0.30%).
| Demographics | Rating | Rank | Single Male Poverty |
| Immigrants | Caribbean | 5.0 /100 | #232 | Tragic 13.3% |
| British | 4.0 /100 | #233 | Tragic 13.3% |
| Canadians | 4.0 /100 | #234 | Tragic 13.3% |
| Bangladeshis | 3.7 /100 | #235 | Tragic 13.3% |
| Luxembourgers | 3.6 /100 | #236 | Tragic 13.4% |
| British West Indians | 3.4 /100 | #237 | Tragic 13.4% |
| Immigrants | Ghana | 3.2 /100 | #238 | Tragic 13.4% |
| Czechoslovakians | 3.0 /100 | #239 | Tragic 13.4% |
| Belizeans | 2.3 /100 | #240 | Tragic 13.4% |
| Immigrants | Germany | 2.1 /100 | #241 | Tragic 13.4% |
| Carpatho Rusyns | 2.1 /100 | #242 | Tragic 13.4% |
| Barbadians | 2.1 /100 | #243 | Tragic 13.4% |
| Immigrants | Senegal | 1.7 /100 | #244 | Tragic 13.5% |
| Immigrants | Latin America | 1.3 /100 | #245 | Tragic 13.5% |
| Immigrants | Micronesia | 1.2 /100 | #246 | Tragic 13.5% |
Demographics Similar to Soviet Union by Single Male Poverty
In terms of single male poverty, the demographic groups most similar to Soviet Union are Sri Lankan (11.5%, a difference of 0.090%), Immigrants from Singapore (11.4%, a difference of 0.15%), Immigrants from Serbia (11.4%, a difference of 0.20%), Immigrants from South Eastern Asia (11.4%, a difference of 0.24%), and Immigrants from Ethiopia (11.4%, a difference of 0.27%).
| Demographics | Rating | Rank | Single Male Poverty |
| Immigrants | Eastern Asia | 100.0 /100 | #32 | Exceptional 11.4% |
| Immigrants | Vietnam | 100.0 /100 | #33 | Exceptional 11.4% |
| Immigrants | Ethiopia | 100.0 /100 | #34 | Exceptional 11.4% |
| Immigrants | South Eastern Asia | 100.0 /100 | #35 | Exceptional 11.4% |
| Immigrants | Serbia | 100.0 /100 | #36 | Exceptional 11.4% |
| Immigrants | Singapore | 100.0 /100 | #37 | Exceptional 11.4% |
| Sri Lankans | 100.0 /100 | #38 | Exceptional 11.5% |
| Soviet Union | 100.0 /100 | #39 | Exceptional 11.5% |
| Immigrants | Korea | 100.0 /100 | #40 | Exceptional 11.5% |
| Immigrants | Iraq | 99.9 /100 | #41 | Exceptional 11.5% |
| Egyptians | 99.9 /100 | #42 | Exceptional 11.5% |
| Immigrants | Peru | 99.9 /100 | #43 | Exceptional 11.5% |
| Immigrants | Cameroon | 99.9 /100 | #44 | Exceptional 11.5% |
| Immigrants | Poland | 99.9 /100 | #45 | Exceptional 11.5% |
| Immigrants | Bulgaria | 99.9 /100 | #46 | Exceptional 11.6% |