Bolivian vs Soviet Union Single Male Poverty
COMPARE
Bolivian
Soviet Union
Single Male Poverty
Single Male Poverty Comparison
Bolivians
Soviet Union
11.2%
SINGLE MALE POVERTY
100.0/ 100
METRIC RATING
23rd/ 347
METRIC RANK
11.5%
SINGLE MALE POVERTY
100.0/ 100
METRIC RATING
39th/ 347
METRIC RANK
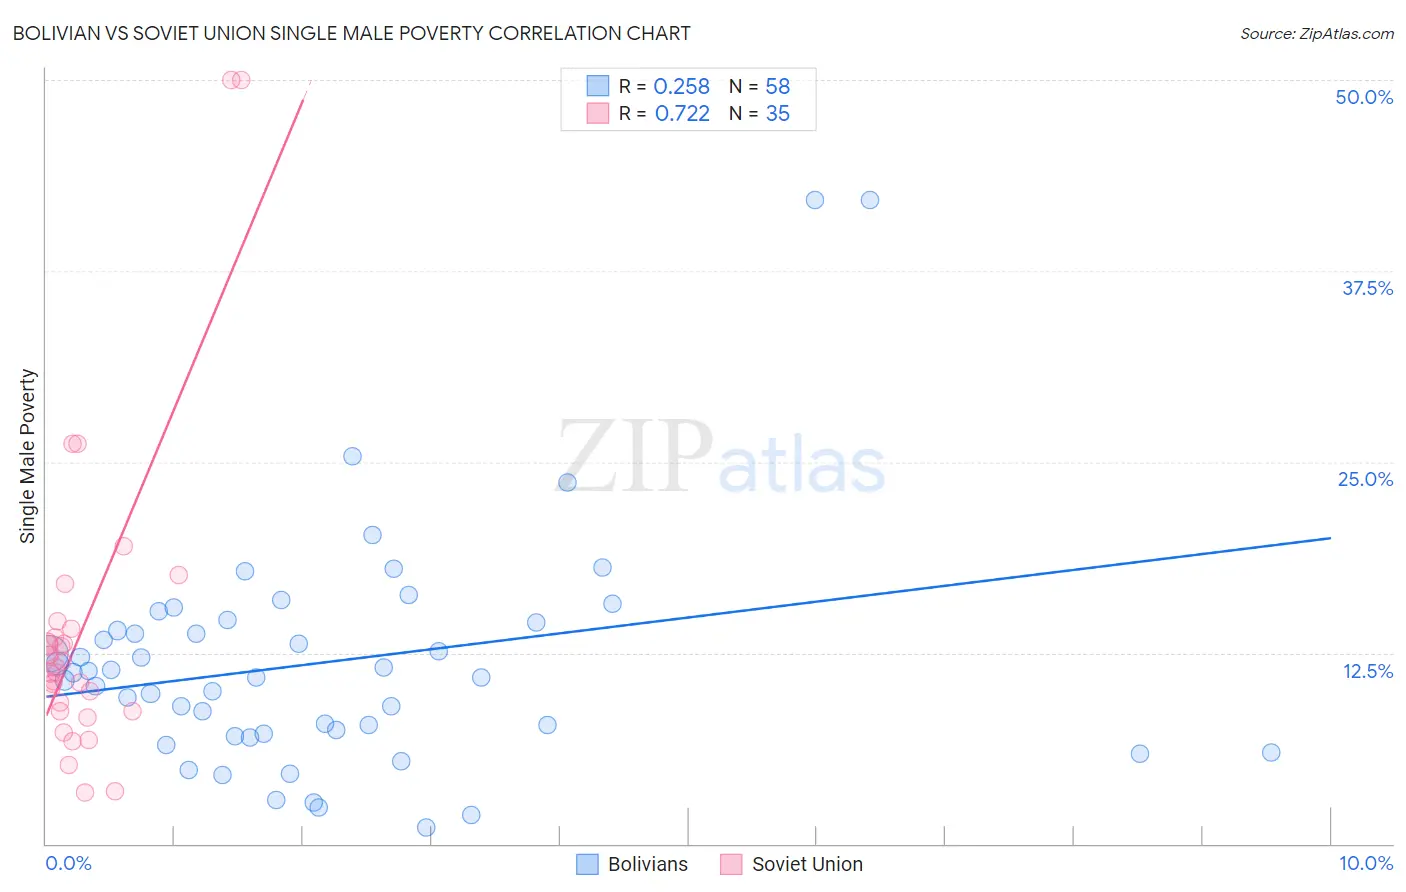
Bolivian vs Soviet Union Single Male Poverty Correlation Chart
The statistical analysis conducted on geographies consisting of 171,550,226 people shows a weak positive correlation between the proportion of Bolivians and poverty level among single males in the United States with a correlation coefficient (R) of 0.258 and weighted average of 11.2%. Similarly, the statistical analysis conducted on geographies consisting of 42,355,679 people shows a strong positive correlation between the proportion of Soviet Union and poverty level among single males in the United States with a correlation coefficient (R) of 0.722 and weighted average of 11.5%, a difference of 2.1%.
Single Male Poverty Correlation Summary
| Measurement | Bolivian | Soviet Union |
| Minimum | 1.1% | 3.3% |
| Maximum | 42.1% | 50.0% |
| Range | 41.0% | 46.7% |
| Mean | 11.9% | 14.0% |
| Median | 11.1% | 11.5% |
| Interquartile 25% (IQ1) | 7.2% | 8.7% |
| Interquartile 75% (IQ3) | 14.5% | 14.1% |
| Interquartile Range (IQR) | 7.3% | 5.4% |
| Standard Deviation (Sample) | 7.7% | 10.3% |
| Standard Deviation (Population) | 7.6% | 10.2% |
Demographics Similar to Bolivians and Soviet Union by Single Male Poverty
In terms of single male poverty, the demographic groups most similar to Bolivians are Indian (Asian) (11.3%, a difference of 0.20%), Immigrants from Pakistan (11.2%, a difference of 0.21%), Maltese (11.3%, a difference of 0.22%), Asian (11.2%, a difference of 0.30%), and Immigrants from Japan (11.3%, a difference of 0.55%). Similarly, the demographic groups most similar to Soviet Union are Sri Lankan (11.5%, a difference of 0.090%), Immigrants from Singapore (11.4%, a difference of 0.15%), Immigrants from Serbia (11.4%, a difference of 0.20%), Immigrants from South Eastern Asia (11.4%, a difference of 0.24%), and Immigrants from Ethiopia (11.4%, a difference of 0.27%).
| Demographics | Rating | Rank | Single Male Poverty |
| Asians | 100.0 /100 | #21 | Exceptional 11.2% |
| Immigrants | Pakistan | 100.0 /100 | #22 | Exceptional 11.2% |
| Bolivians | 100.0 /100 | #23 | Exceptional 11.2% |
| Indians (Asian) | 100.0 /100 | #24 | Exceptional 11.3% |
| Maltese | 100.0 /100 | #25 | Exceptional 11.3% |
| Immigrants | Japan | 100.0 /100 | #26 | Exceptional 11.3% |
| Immigrants | China | 100.0 /100 | #27 | Exceptional 11.4% |
| Immigrants | Asia | 100.0 /100 | #28 | Exceptional 11.4% |
| Immigrants | Egypt | 100.0 /100 | #29 | Exceptional 11.4% |
| Iranians | 100.0 /100 | #30 | Exceptional 11.4% |
| Immigrants | Iran | 100.0 /100 | #31 | Exceptional 11.4% |
| Immigrants | Eastern Asia | 100.0 /100 | #32 | Exceptional 11.4% |
| Immigrants | Vietnam | 100.0 /100 | #33 | Exceptional 11.4% |
| Immigrants | Ethiopia | 100.0 /100 | #34 | Exceptional 11.4% |
| Immigrants | South Eastern Asia | 100.0 /100 | #35 | Exceptional 11.4% |
| Immigrants | Serbia | 100.0 /100 | #36 | Exceptional 11.4% |
| Immigrants | Singapore | 100.0 /100 | #37 | Exceptional 11.4% |
| Sri Lankans | 100.0 /100 | #38 | Exceptional 11.5% |
| Soviet Union | 100.0 /100 | #39 | Exceptional 11.5% |
| Immigrants | Korea | 100.0 /100 | #40 | Exceptional 11.5% |
| Immigrants | Iraq | 99.9 /100 | #41 | Exceptional 11.5% |