Czechoslovakian vs Shoshone Single Male Poverty
COMPARE
Czechoslovakian
Shoshone
Single Male Poverty
Single Male Poverty Comparison
Czechoslovakians
Shoshone
13.4%
SINGLE MALE POVERTY
3.0/ 100
METRIC RATING
239th/ 347
METRIC RANK
16.7%
SINGLE MALE POVERTY
0.0/ 100
METRIC RATING
322nd/ 347
METRIC RANK
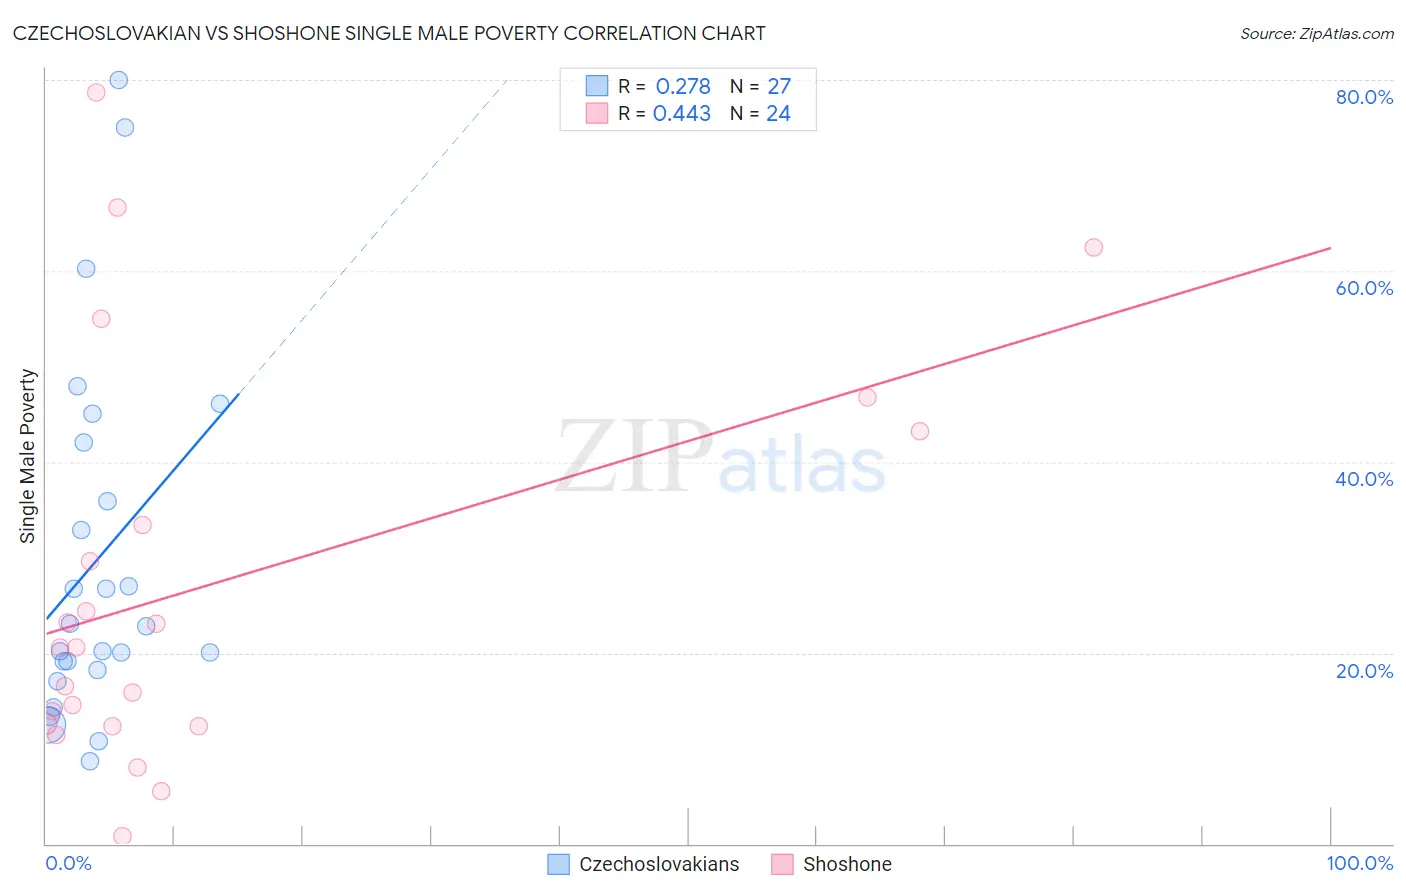
Czechoslovakian vs Shoshone Single Male Poverty Correlation Chart
The statistical analysis conducted on geographies consisting of 321,828,483 people shows a weak positive correlation between the proportion of Czechoslovakians and poverty level among single males in the United States with a correlation coefficient (R) of 0.278 and weighted average of 13.4%. Similarly, the statistical analysis conducted on geographies consisting of 64,727,315 people shows a moderate positive correlation between the proportion of Shoshone and poverty level among single males in the United States with a correlation coefficient (R) of 0.443 and weighted average of 16.7%, a difference of 24.5%.
Single Male Poverty Correlation Summary
| Measurement | Czechoslovakian | Shoshone |
| Minimum | 8.6% | 0.78% |
| Maximum | 80.0% | 78.7% |
| Range | 71.4% | 77.9% |
| Mean | 29.8% | 27.1% |
| Median | 22.7% | 20.6% |
| Interquartile 25% (IQ1) | 18.2% | 12.4% |
| Interquartile 75% (IQ3) | 42.1% | 38.3% |
| Interquartile Range (IQR) | 23.9% | 25.9% |
| Standard Deviation (Sample) | 18.8% | 20.9% |
| Standard Deviation (Population) | 18.4% | 20.5% |
Similar Demographics by Single Male Poverty
Demographics Similar to Czechoslovakians by Single Male Poverty
In terms of single male poverty, the demographic groups most similar to Czechoslovakians are Immigrants from Ghana (13.4%, a difference of 0.080%), British West Indian (13.4%, a difference of 0.18%), Luxembourger (13.4%, a difference of 0.24%), Bangladeshi (13.3%, a difference of 0.29%), and Belizean (13.4%, a difference of 0.30%).
| Demographics | Rating | Rank | Single Male Poverty |
| Immigrants | Caribbean | 5.0 /100 | #232 | Tragic 13.3% |
| British | 4.0 /100 | #233 | Tragic 13.3% |
| Canadians | 4.0 /100 | #234 | Tragic 13.3% |
| Bangladeshis | 3.7 /100 | #235 | Tragic 13.3% |
| Luxembourgers | 3.6 /100 | #236 | Tragic 13.4% |
| British West Indians | 3.4 /100 | #237 | Tragic 13.4% |
| Immigrants | Ghana | 3.2 /100 | #238 | Tragic 13.4% |
| Czechoslovakians | 3.0 /100 | #239 | Tragic 13.4% |
| Belizeans | 2.3 /100 | #240 | Tragic 13.4% |
| Immigrants | Germany | 2.1 /100 | #241 | Tragic 13.4% |
| Carpatho Rusyns | 2.1 /100 | #242 | Tragic 13.4% |
| Barbadians | 2.1 /100 | #243 | Tragic 13.4% |
| Immigrants | Senegal | 1.7 /100 | #244 | Tragic 13.5% |
| Immigrants | Latin America | 1.3 /100 | #245 | Tragic 13.5% |
| Immigrants | Micronesia | 1.2 /100 | #246 | Tragic 13.5% |
Demographics Similar to Shoshone by Single Male Poverty
In terms of single male poverty, the demographic groups most similar to Shoshone are Creek (16.8%, a difference of 1.0%), Immigrants from Yemen (16.9%, a difference of 1.1%), Osage (16.5%, a difference of 1.3%), Marshallese (16.4%, a difference of 1.4%), and Chippewa (16.4%, a difference of 1.9%).
| Demographics | Rating | Rank | Single Male Poverty |
| Cheyenne | 0.0 /100 | #315 | Tragic 16.1% |
| Dutch West Indians | 0.0 /100 | #316 | Tragic 16.1% |
| Blacks/African Americans | 0.0 /100 | #317 | Tragic 16.2% |
| Chickasaw | 0.0 /100 | #318 | Tragic 16.3% |
| Chippewa | 0.0 /100 | #319 | Tragic 16.4% |
| Marshallese | 0.0 /100 | #320 | Tragic 16.4% |
| Osage | 0.0 /100 | #321 | Tragic 16.5% |
| Shoshone | 0.0 /100 | #322 | Tragic 16.7% |
| Creek | 0.0 /100 | #323 | Tragic 16.8% |
| Immigrants | Yemen | 0.0 /100 | #324 | Tragic 16.9% |
| Choctaw | 0.0 /100 | #325 | Tragic 17.0% |
| Central American Indians | 0.0 /100 | #326 | Tragic 17.2% |
| Menominee | 0.0 /100 | #327 | Tragic 17.7% |
| Kiowa | 0.0 /100 | #328 | Tragic 18.3% |
| Colville | 0.0 /100 | #329 | Tragic 18.4% |