Czechoslovakian vs Soviet Union No Schooling Completed
COMPARE
Czechoslovakian
Soviet Union
No Schooling Completed
No Schooling Completed Comparison
Czechoslovakians
Soviet Union
1.6%
NO SCHOOLING COMPLETED
99.9/ 100
METRIC RATING
45th/ 347
METRIC RANK
2.0%
NO SCHOOLING COMPLETED
77.1/ 100
METRIC RATING
147th/ 347
METRIC RANK
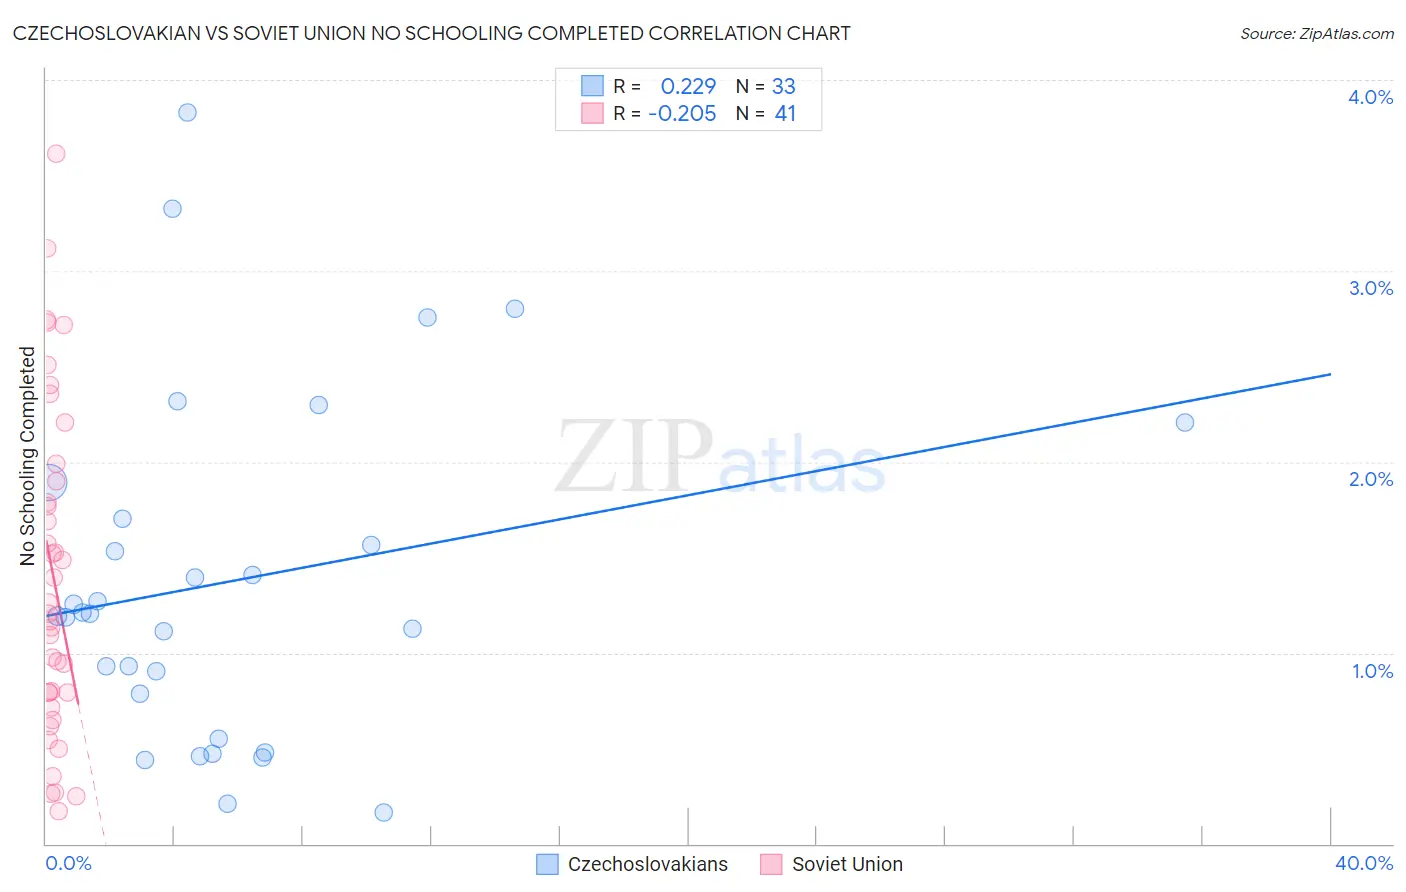
Czechoslovakian vs Soviet Union No Schooling Completed Correlation Chart
The statistical analysis conducted on geographies consisting of 363,588,440 people shows a weak positive correlation between the proportion of Czechoslovakians and percentage of population with no schooling in the United States with a correlation coefficient (R) of 0.229 and weighted average of 1.6%. Similarly, the statistical analysis conducted on geographies consisting of 43,404,550 people shows a weak negative correlation between the proportion of Soviet Union and percentage of population with no schooling in the United States with a correlation coefficient (R) of -0.205 and weighted average of 2.0%, a difference of 23.7%.
No Schooling Completed Correlation Summary
| Measurement | Czechoslovakian | Soviet Union |
| Minimum | 0.16% | 0.17% |
| Maximum | 3.8% | 3.6% |
| Range | 3.7% | 3.4% |
| Mean | 1.4% | 1.4% |
| Median | 1.2% | 1.2% |
| Interquartile 25% (IQ1) | 0.67% | 0.75% |
| Interquartile 75% (IQ3) | 1.8% | 1.9% |
| Interquartile Range (IQR) | 1.1% | 1.2% |
| Standard Deviation (Sample) | 0.89% | 0.87% |
| Standard Deviation (Population) | 0.88% | 0.86% |
Similar Demographics by No Schooling Completed
Demographics Similar to Czechoslovakians by No Schooling Completed
In terms of no schooling completed, the demographic groups most similar to Czechoslovakians are Estonian (1.6%, a difference of 0.040%), Maltese (1.6%, a difference of 0.090%), Australian (1.6%, a difference of 0.23%), Ottawa (1.6%, a difference of 0.24%), and Bulgarian (1.6%, a difference of 0.35%).
| Demographics | Rating | Rank | No Schooling Completed |
| Northern Europeans | 99.9 /100 | #38 | Exceptional 1.6% |
| Native Hawaiians | 99.9 /100 | #39 | Exceptional 1.6% |
| Luxembourgers | 99.9 /100 | #40 | Exceptional 1.6% |
| Hungarians | 99.9 /100 | #41 | Exceptional 1.6% |
| Bulgarians | 99.9 /100 | #42 | Exceptional 1.6% |
| Australians | 99.9 /100 | #43 | Exceptional 1.6% |
| Estonians | 99.9 /100 | #44 | Exceptional 1.6% |
| Czechoslovakians | 99.9 /100 | #45 | Exceptional 1.6% |
| Maltese | 99.9 /100 | #46 | Exceptional 1.6% |
| Ottawa | 99.9 /100 | #47 | Exceptional 1.6% |
| Immigrants | Scotland | 99.9 /100 | #48 | Exceptional 1.6% |
| Whites/Caucasians | 99.9 /100 | #49 | Exceptional 1.6% |
| Celtics | 99.9 /100 | #50 | Exceptional 1.6% |
| Chippewa | 99.8 /100 | #51 | Exceptional 1.6% |
| Immigrants | Canada | 99.8 /100 | #52 | Exceptional 1.6% |
Demographics Similar to Soviet Union by No Schooling Completed
In terms of no schooling completed, the demographic groups most similar to Soviet Union are Shoshone (2.0%, a difference of 0.080%), Immigrants from Moldova (2.0%, a difference of 0.17%), Immigrants from North Macedonia (2.0%, a difference of 0.24%), Immigrants from Iran (2.0%, a difference of 0.39%), and Alsatian (2.0%, a difference of 0.40%).
| Demographics | Rating | Rank | No Schooling Completed |
| Marshallese | 83.5 /100 | #140 | Excellent 2.0% |
| Immigrants | Greece | 83.5 /100 | #141 | Excellent 2.0% |
| Venezuelans | 81.5 /100 | #142 | Excellent 2.0% |
| Immigrants | South Central Asia | 80.0 /100 | #143 | Good 2.0% |
| Alsatians | 79.1 /100 | #144 | Good 2.0% |
| Immigrants | Iran | 79.0 /100 | #145 | Good 2.0% |
| Immigrants | Moldova | 78.0 /100 | #146 | Good 2.0% |
| Soviet Union | 77.1 /100 | #147 | Good 2.0% |
| Shoshone | 76.7 /100 | #148 | Good 2.0% |
| Immigrants | North Macedonia | 75.9 /100 | #149 | Good 2.0% |
| Blackfeet | 72.9 /100 | #150 | Good 2.0% |
| Immigrants | Jordan | 70.9 /100 | #151 | Good 2.0% |
| Immigrants | Eastern Europe | 70.4 /100 | #152 | Good 2.0% |
| Immigrants | Italy | 68.9 /100 | #153 | Good 2.0% |
| Immigrants | Venezuela | 68.5 /100 | #154 | Good 2.0% |