Cambodian vs Soviet Union Single Male Poverty
COMPARE
Cambodian
Soviet Union
Single Male Poverty
Single Male Poverty Comparison
Cambodians
Soviet Union
11.8%
SINGLE MALE POVERTY
99.8/ 100
METRIC RATING
61st/ 347
METRIC RANK
11.5%
SINGLE MALE POVERTY
100.0/ 100
METRIC RATING
39th/ 347
METRIC RANK
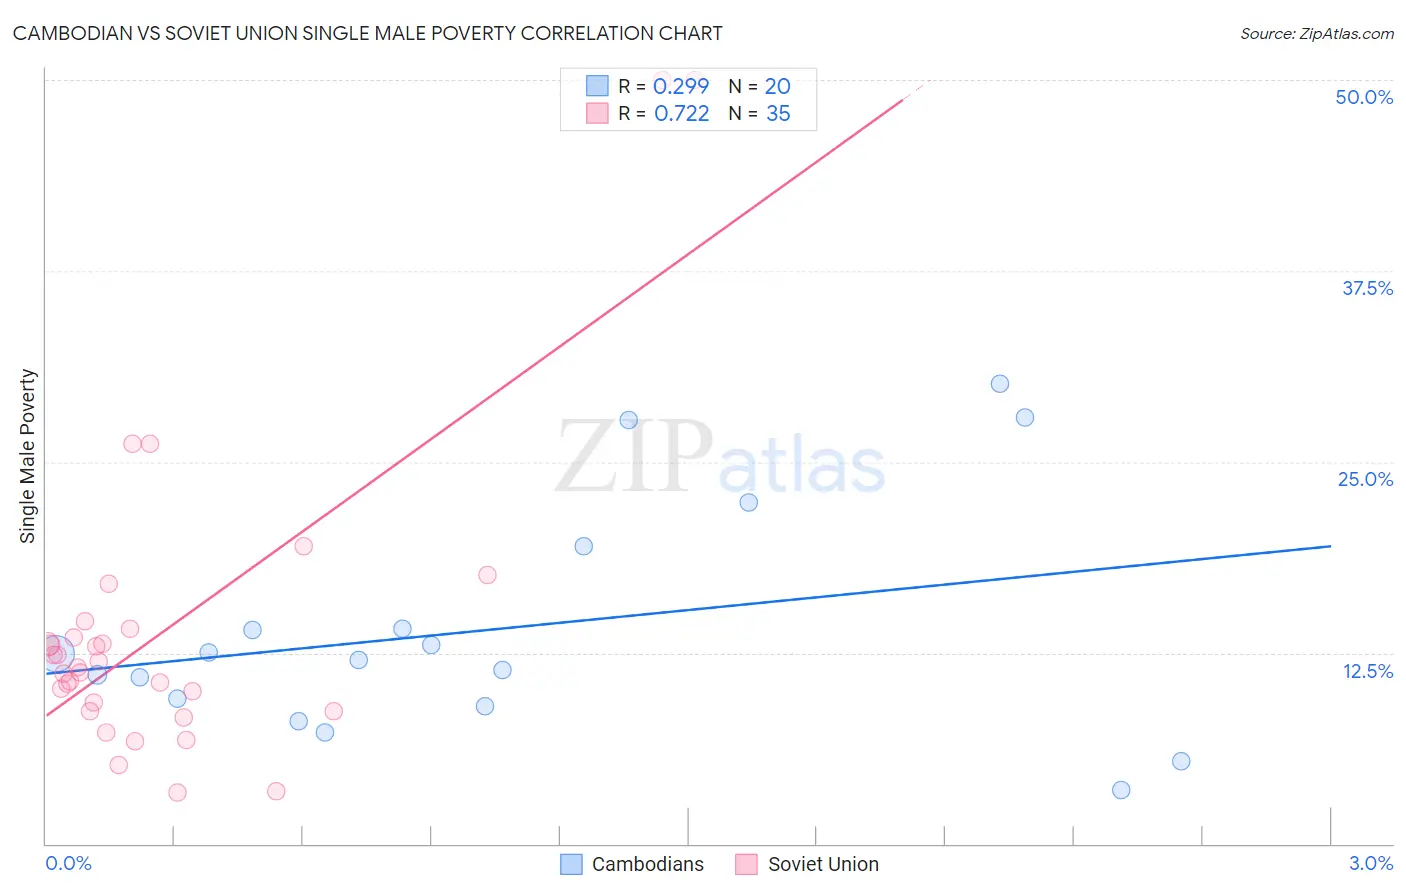
Cambodian vs Soviet Union Single Male Poverty Correlation Chart
The statistical analysis conducted on geographies consisting of 97,412,896 people shows a weak positive correlation between the proportion of Cambodians and poverty level among single males in the United States with a correlation coefficient (R) of 0.299 and weighted average of 11.8%. Similarly, the statistical analysis conducted on geographies consisting of 42,355,679 people shows a strong positive correlation between the proportion of Soviet Union and poverty level among single males in the United States with a correlation coefficient (R) of 0.722 and weighted average of 11.5%, a difference of 2.7%.
Single Male Poverty Correlation Summary
| Measurement | Cambodian | Soviet Union |
| Minimum | 3.5% | 3.3% |
| Maximum | 30.1% | 50.0% |
| Range | 26.6% | 46.7% |
| Mean | 14.1% | 14.0% |
| Median | 12.2% | 11.5% |
| Interquartile 25% (IQ1) | 9.2% | 8.7% |
| Interquartile 75% (IQ3) | 16.8% | 14.1% |
| Interquartile Range (IQR) | 7.5% | 5.4% |
| Standard Deviation (Sample) | 7.6% | 10.3% |
| Standard Deviation (Population) | 7.4% | 10.2% |
Similar Demographics by Single Male Poverty
Demographics Similar to Cambodians by Single Male Poverty
In terms of single male poverty, the demographic groups most similar to Cambodians are Peruvian (11.8%, a difference of 0.020%), Brazilian (11.8%, a difference of 0.23%), Immigrants from Brazil (11.7%, a difference of 0.32%), Immigrants from Romania (11.7%, a difference of 0.34%), and Immigrants from Sri Lanka (11.8%, a difference of 0.38%).
| Demographics | Rating | Rank | Single Male Poverty |
| Immigrants | Uzbekistan | 99.9 /100 | #54 | Exceptional 11.7% |
| Cypriots | 99.9 /100 | #55 | Exceptional 11.7% |
| Burmese | 99.8 /100 | #56 | Exceptional 11.7% |
| Immigrants | Romania | 99.8 /100 | #57 | Exceptional 11.7% |
| Immigrants | Brazil | 99.8 /100 | #58 | Exceptional 11.7% |
| Brazilians | 99.8 /100 | #59 | Exceptional 11.8% |
| Peruvians | 99.8 /100 | #60 | Exceptional 11.8% |
| Cambodians | 99.8 /100 | #61 | Exceptional 11.8% |
| Immigrants | Sri Lanka | 99.7 /100 | #62 | Exceptional 11.8% |
| Immigrants | Belarus | 99.7 /100 | #63 | Exceptional 11.8% |
| Immigrants | Eastern Europe | 99.6 /100 | #64 | Exceptional 11.8% |
| Laotians | 99.6 /100 | #65 | Exceptional 11.9% |
| Immigrants | Uruguay | 99.6 /100 | #66 | Exceptional 11.9% |
| Immigrants | Ukraine | 99.6 /100 | #67 | Exceptional 11.9% |
| Immigrants | Croatia | 99.6 /100 | #68 | Exceptional 11.9% |
Demographics Similar to Soviet Union by Single Male Poverty
In terms of single male poverty, the demographic groups most similar to Soviet Union are Sri Lankan (11.5%, a difference of 0.090%), Immigrants from Singapore (11.4%, a difference of 0.15%), Immigrants from Serbia (11.4%, a difference of 0.20%), Immigrants from South Eastern Asia (11.4%, a difference of 0.24%), and Immigrants from Ethiopia (11.4%, a difference of 0.27%).
| Demographics | Rating | Rank | Single Male Poverty |
| Immigrants | Eastern Asia | 100.0 /100 | #32 | Exceptional 11.4% |
| Immigrants | Vietnam | 100.0 /100 | #33 | Exceptional 11.4% |
| Immigrants | Ethiopia | 100.0 /100 | #34 | Exceptional 11.4% |
| Immigrants | South Eastern Asia | 100.0 /100 | #35 | Exceptional 11.4% |
| Immigrants | Serbia | 100.0 /100 | #36 | Exceptional 11.4% |
| Immigrants | Singapore | 100.0 /100 | #37 | Exceptional 11.4% |
| Sri Lankans | 100.0 /100 | #38 | Exceptional 11.5% |
| Soviet Union | 100.0 /100 | #39 | Exceptional 11.5% |
| Immigrants | Korea | 100.0 /100 | #40 | Exceptional 11.5% |
| Immigrants | Iraq | 99.9 /100 | #41 | Exceptional 11.5% |
| Egyptians | 99.9 /100 | #42 | Exceptional 11.5% |
| Immigrants | Peru | 99.9 /100 | #43 | Exceptional 11.5% |
| Immigrants | Cameroon | 99.9 /100 | #44 | Exceptional 11.5% |
| Immigrants | Poland | 99.9 /100 | #45 | Exceptional 11.5% |
| Immigrants | Bulgaria | 99.9 /100 | #46 | Exceptional 11.6% |