Czechoslovakian vs Soviet Union Average Family Size
COMPARE
Czechoslovakian
Soviet Union
Average Family Size
Average Family Size Comparison
Czechoslovakians
Soviet Union
3.13
AVERAGE FAMILY SIZE
0.1/ 100
METRIC RATING
310th/ 347
METRIC RANK
3.11
AVERAGE FAMILY SIZE
0.0/ 100
METRIC RATING
323rd/ 347
METRIC RANK
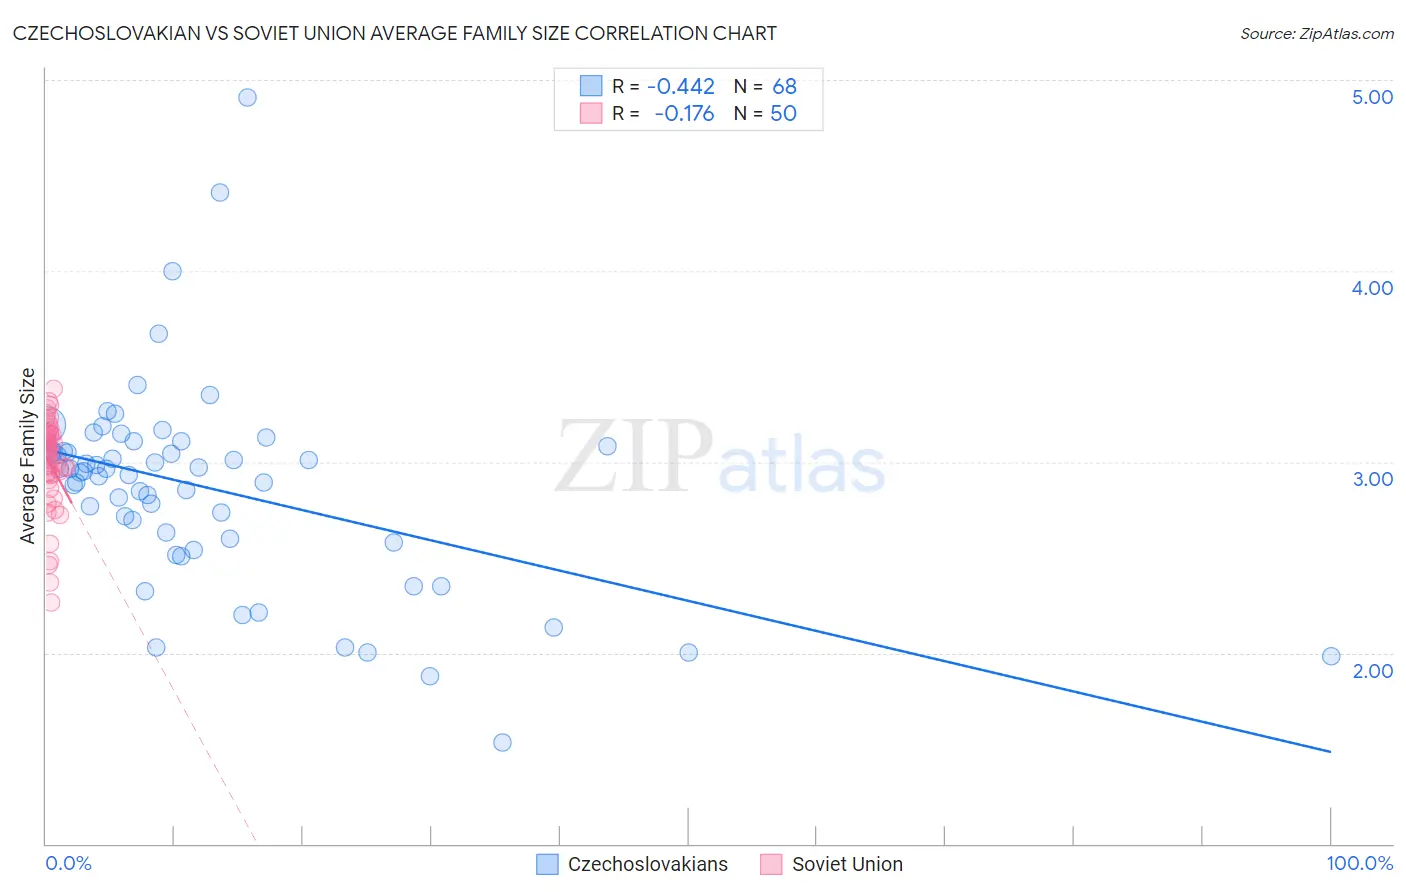
Czechoslovakian vs Soviet Union Average Family Size Correlation Chart
The statistical analysis conducted on geographies consisting of 368,525,385 people shows a moderate negative correlation between the proportion of Czechoslovakians and average family size in the United States with a correlation coefficient (R) of -0.442 and weighted average of 3.13. Similarly, the statistical analysis conducted on geographies consisting of 43,509,630 people shows a poor negative correlation between the proportion of Soviet Union and average family size in the United States with a correlation coefficient (R) of -0.176 and weighted average of 3.11, a difference of 0.42%.
Average Family Size Correlation Summary
| Measurement | Czechoslovakian | Soviet Union |
| Minimum | 1.53 | 2.27 |
| Maximum | 4.91 | 3.38 |
| Range | 3.38 | 1.11 |
| Mean | 2.86 | 2.99 |
| Median | 2.95 | 3.05 |
| Interquartile 25% (IQ1) | 2.59 | 2.93 |
| Interquartile 75% (IQ3) | 3.07 | 3.15 |
| Interquartile Range (IQR) | 0.48 | 0.22 |
| Standard Deviation (Sample) | 0.54 | 0.24 |
| Standard Deviation (Population) | 0.54 | 0.24 |
Demographics Similar to Czechoslovakians and Soviet Union by Average Family Size
In terms of average family size, the demographic groups most similar to Czechoslovakians are Northern European (3.13, a difference of 0.020%), Slavic (3.13, a difference of 0.030%), Immigrants from Northern Europe (3.13, a difference of 0.040%), Immigrants from Australia (3.13, a difference of 0.060%), and Bulgarian (3.13, a difference of 0.070%). Similarly, the demographic groups most similar to Soviet Union are Immigrants from Austria (3.12, a difference of 0.030%), Immigrants from Canada (3.12, a difference of 0.030%), Immigrants from North America (3.12, a difference of 0.060%), Celtic (3.11, a difference of 0.080%), and English (3.11, a difference of 0.12%).
| Demographics | Rating | Rank | Average Family Size |
| Immigrants | Ireland | 0.1 /100 | #306 | Tragic 3.13 |
| Immigrants | Serbia | 0.1 /100 | #307 | Tragic 3.13 |
| Slavs | 0.1 /100 | #308 | Tragic 3.13 |
| Northern Europeans | 0.1 /100 | #309 | Tragic 3.13 |
| Czechoslovakians | 0.1 /100 | #310 | Tragic 3.13 |
| Immigrants | Northern Europe | 0.1 /100 | #311 | Tragic 3.13 |
| Immigrants | Australia | 0.1 /100 | #312 | Tragic 3.13 |
| Bulgarians | 0.1 /100 | #313 | Tragic 3.13 |
| Russians | 0.1 /100 | #314 | Tragic 3.12 |
| Immigrants | Scotland | 0.1 /100 | #315 | Tragic 3.12 |
| Serbians | 0.1 /100 | #316 | Tragic 3.12 |
| Italians | 0.1 /100 | #317 | Tragic 3.12 |
| Eastern Europeans | 0.1 /100 | #318 | Tragic 3.12 |
| Welsh | 0.1 /100 | #319 | Tragic 3.12 |
| Immigrants | North America | 0.0 /100 | #320 | Tragic 3.12 |
| Immigrants | Austria | 0.0 /100 | #321 | Tragic 3.12 |
| Immigrants | Canada | 0.0 /100 | #322 | Tragic 3.12 |
| Soviet Union | 0.0 /100 | #323 | Tragic 3.11 |
| Celtics | 0.0 /100 | #324 | Tragic 3.11 |
| English | 0.0 /100 | #325 | Tragic 3.11 |
| Ottawa | 0.0 /100 | #326 | Tragic 3.11 |