Czechoslovakian vs Inupiat Single Male Poverty
COMPARE
Czechoslovakian
Inupiat
Single Male Poverty
Single Male Poverty Comparison
Czechoslovakians
Inupiat
13.4%
SINGLE MALE POVERTY
3.0/ 100
METRIC RATING
239th/ 347
METRIC RANK
20.0%
SINGLE MALE POVERTY
0.0/ 100
METRIC RATING
333rd/ 347
METRIC RANK
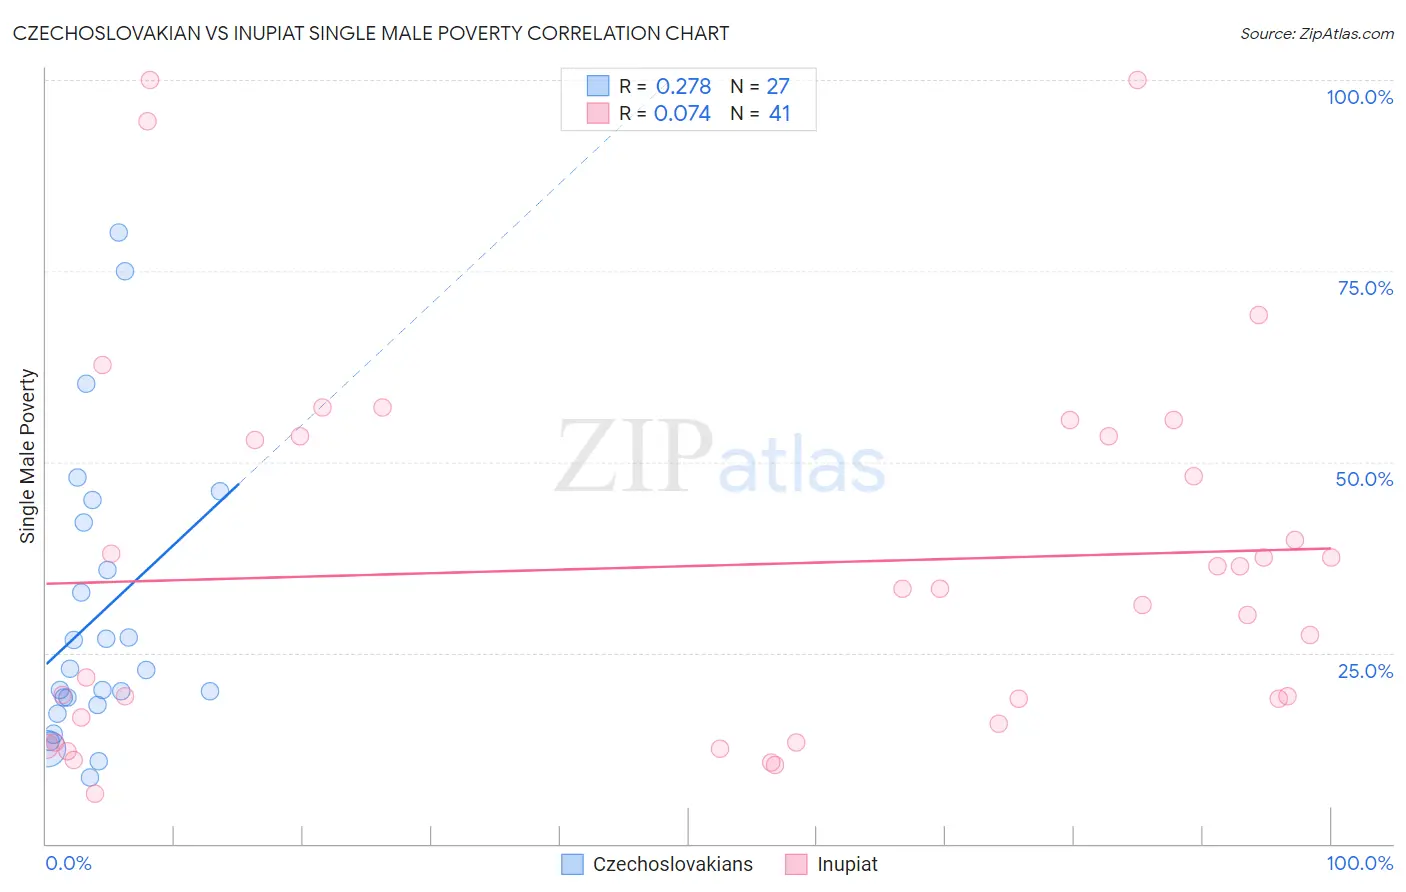
Czechoslovakian vs Inupiat Single Male Poverty Correlation Chart
The statistical analysis conducted on geographies consisting of 321,828,483 people shows a weak positive correlation between the proportion of Czechoslovakians and poverty level among single males in the United States with a correlation coefficient (R) of 0.278 and weighted average of 13.4%. Similarly, the statistical analysis conducted on geographies consisting of 93,554,052 people shows a slight positive correlation between the proportion of Inupiat and poverty level among single males in the United States with a correlation coefficient (R) of 0.074 and weighted average of 20.0%, a difference of 49.3%.
Single Male Poverty Correlation Summary
| Measurement | Czechoslovakian | Inupiat |
| Minimum | 8.6% | 6.5% |
| Maximum | 80.0% | 100.0% |
| Range | 71.4% | 93.5% |
| Mean | 29.8% | 36.4% |
| Median | 22.7% | 33.3% |
| Interquartile 25% (IQ1) | 18.2% | 16.1% |
| Interquartile 75% (IQ3) | 42.1% | 53.3% |
| Interquartile Range (IQR) | 23.9% | 37.2% |
| Standard Deviation (Sample) | 18.8% | 24.6% |
| Standard Deviation (Population) | 18.4% | 24.3% |
Similar Demographics by Single Male Poverty
Demographics Similar to Czechoslovakians by Single Male Poverty
In terms of single male poverty, the demographic groups most similar to Czechoslovakians are Immigrants from Ghana (13.4%, a difference of 0.080%), British West Indian (13.4%, a difference of 0.18%), Luxembourger (13.4%, a difference of 0.24%), Bangladeshi (13.3%, a difference of 0.29%), and Belizean (13.4%, a difference of 0.30%).
| Demographics | Rating | Rank | Single Male Poverty |
| Immigrants | Caribbean | 5.0 /100 | #232 | Tragic 13.3% |
| British | 4.0 /100 | #233 | Tragic 13.3% |
| Canadians | 4.0 /100 | #234 | Tragic 13.3% |
| Bangladeshis | 3.7 /100 | #235 | Tragic 13.3% |
| Luxembourgers | 3.6 /100 | #236 | Tragic 13.4% |
| British West Indians | 3.4 /100 | #237 | Tragic 13.4% |
| Immigrants | Ghana | 3.2 /100 | #238 | Tragic 13.4% |
| Czechoslovakians | 3.0 /100 | #239 | Tragic 13.4% |
| Belizeans | 2.3 /100 | #240 | Tragic 13.4% |
| Immigrants | Germany | 2.1 /100 | #241 | Tragic 13.4% |
| Carpatho Rusyns | 2.1 /100 | #242 | Tragic 13.4% |
| Barbadians | 2.1 /100 | #243 | Tragic 13.4% |
| Immigrants | Senegal | 1.7 /100 | #244 | Tragic 13.5% |
| Immigrants | Latin America | 1.3 /100 | #245 | Tragic 13.5% |
| Immigrants | Micronesia | 1.2 /100 | #246 | Tragic 13.5% |
Demographics Similar to Inupiat by Single Male Poverty
In terms of single male poverty, the demographic groups most similar to Inupiat are Pima (20.2%, a difference of 0.80%), Native/Alaskan (19.6%, a difference of 1.9%), Paiute (19.3%, a difference of 3.6%), Cajun (19.1%, a difference of 4.8%), and Yuman (21.3%, a difference of 6.6%).
| Demographics | Rating | Rank | Single Male Poverty |
| Central American Indians | 0.0 /100 | #326 | Tragic 17.2% |
| Menominee | 0.0 /100 | #327 | Tragic 17.7% |
| Kiowa | 0.0 /100 | #328 | Tragic 18.3% |
| Colville | 0.0 /100 | #329 | Tragic 18.4% |
| Cajuns | 0.0 /100 | #330 | Tragic 19.1% |
| Paiute | 0.0 /100 | #331 | Tragic 19.3% |
| Natives/Alaskans | 0.0 /100 | #332 | Tragic 19.6% |
| Inupiat | 0.0 /100 | #333 | Tragic 20.0% |
| Pima | 0.0 /100 | #334 | Tragic 20.2% |
| Yuman | 0.0 /100 | #335 | Tragic 21.3% |
| Tohono O'odham | 0.0 /100 | #336 | Tragic 21.6% |
| Apache | 0.0 /100 | #337 | Tragic 21.6% |
| Pueblo | 0.0 /100 | #338 | Tragic 21.6% |
| Arapaho | 0.0 /100 | #339 | Tragic 21.9% |
| Sioux | 0.0 /100 | #340 | Tragic 22.2% |