Vietnamese vs Soviet Union Single Male Poverty
COMPARE
Vietnamese
Soviet Union
Single Male Poverty
Single Male Poverty Comparison
Vietnamese
Soviet Union
12.7%
SINGLE MALE POVERTY
67.9/ 100
METRIC RATING
156th/ 347
METRIC RANK
11.5%
SINGLE MALE POVERTY
100.0/ 100
METRIC RATING
39th/ 347
METRIC RANK
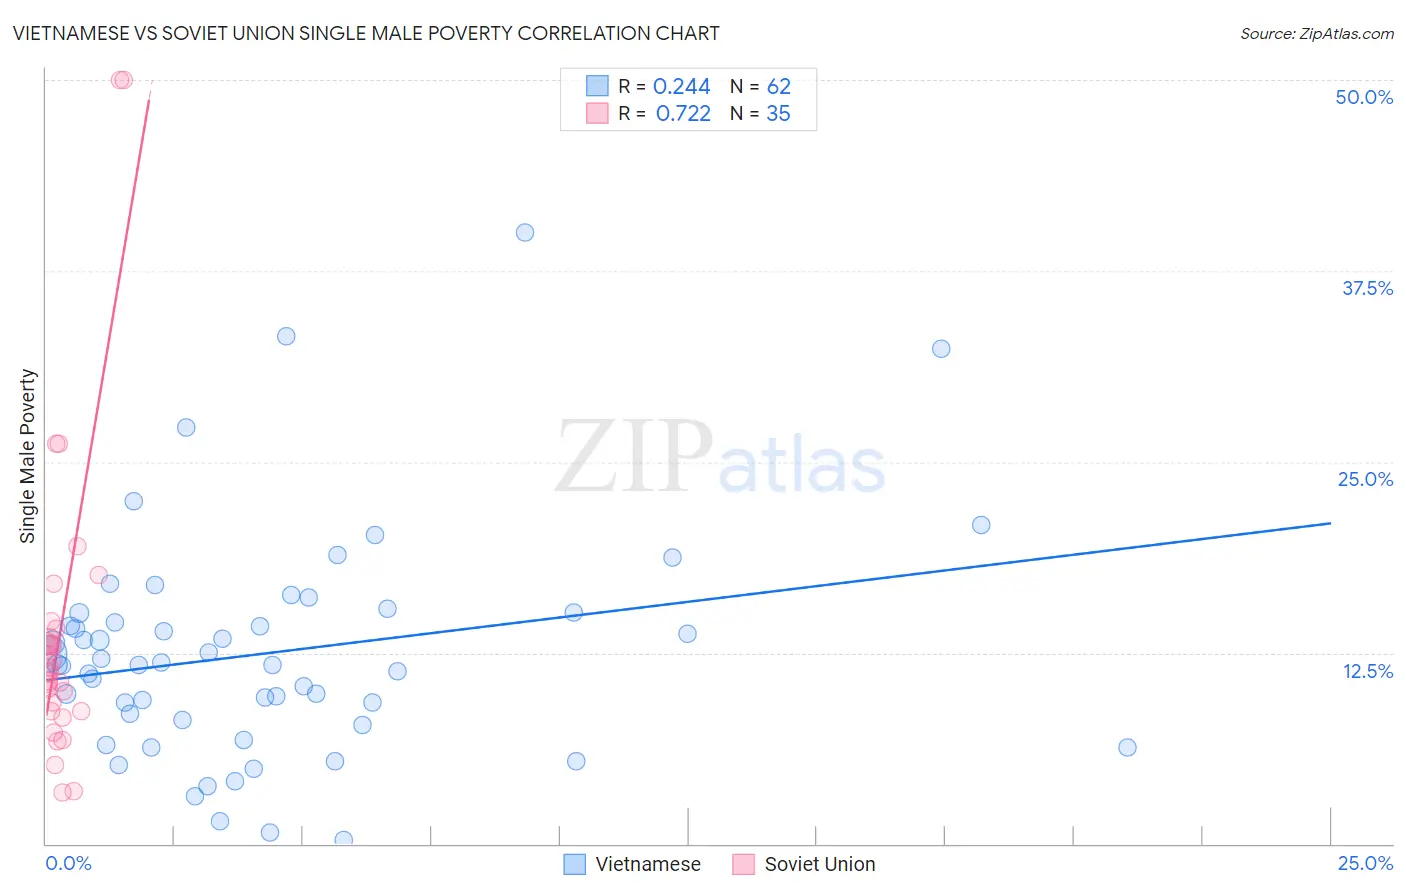
Vietnamese vs Soviet Union Single Male Poverty Correlation Chart
The statistical analysis conducted on geographies consisting of 159,434,170 people shows a weak positive correlation between the proportion of Vietnamese and poverty level among single males in the United States with a correlation coefficient (R) of 0.244 and weighted average of 12.7%. Similarly, the statistical analysis conducted on geographies consisting of 42,355,679 people shows a strong positive correlation between the proportion of Soviet Union and poverty level among single males in the United States with a correlation coefficient (R) of 0.722 and weighted average of 11.5%, a difference of 10.5%.
Single Male Poverty Correlation Summary
| Measurement | Vietnamese | Soviet Union |
| Minimum | 0.23% | 3.3% |
| Maximum | 40.0% | 50.0% |
| Range | 39.8% | 46.7% |
| Mean | 12.5% | 14.0% |
| Median | 11.7% | 11.5% |
| Interquartile 25% (IQ1) | 8.1% | 8.7% |
| Interquartile 75% (IQ3) | 15.1% | 14.1% |
| Interquartile Range (IQR) | 7.0% | 5.4% |
| Standard Deviation (Sample) | 7.4% | 10.3% |
| Standard Deviation (Population) | 7.4% | 10.2% |
Similar Demographics by Single Male Poverty
Demographics Similar to Vietnamese by Single Male Poverty
In terms of single male poverty, the demographic groups most similar to Vietnamese are Latvian (12.7%, a difference of 0.0%), Immigrants from Spain (12.7%, a difference of 0.040%), Immigrants from Scotland (12.7%, a difference of 0.060%), Immigrants (12.7%, a difference of 0.13%), and Immigrants from Middle Africa (12.7%, a difference of 0.18%).
| Demographics | Rating | Rank | Single Male Poverty |
| Sierra Leoneans | 73.0 /100 | #149 | Good 12.6% |
| Immigrants | Panama | 72.1 /100 | #150 | Good 12.6% |
| Immigrants | Hungary | 71.9 /100 | #151 | Good 12.6% |
| Australians | 71.4 /100 | #152 | Good 12.6% |
| Immigrants | Immigrants | 70.1 /100 | #153 | Good 12.7% |
| Immigrants | Scotland | 68.9 /100 | #154 | Good 12.7% |
| Immigrants | Spain | 68.7 /100 | #155 | Good 12.7% |
| Vietnamese | 67.9 /100 | #156 | Good 12.7% |
| Latvians | 67.9 /100 | #157 | Good 12.7% |
| Immigrants | Middle Africa | 64.9 /100 | #158 | Good 12.7% |
| Immigrants | Liberia | 64.2 /100 | #159 | Good 12.7% |
| Greeks | 64.1 /100 | #160 | Good 12.7% |
| Immigrants | Africa | 63.4 /100 | #161 | Good 12.7% |
| Eastern Europeans | 63.3 /100 | #162 | Good 12.7% |
| Palestinians | 63.1 /100 | #163 | Good 12.7% |
Demographics Similar to Soviet Union by Single Male Poverty
In terms of single male poverty, the demographic groups most similar to Soviet Union are Sri Lankan (11.5%, a difference of 0.090%), Immigrants from Singapore (11.4%, a difference of 0.15%), Immigrants from Serbia (11.4%, a difference of 0.20%), Immigrants from South Eastern Asia (11.4%, a difference of 0.24%), and Immigrants from Ethiopia (11.4%, a difference of 0.27%).
| Demographics | Rating | Rank | Single Male Poverty |
| Immigrants | Eastern Asia | 100.0 /100 | #32 | Exceptional 11.4% |
| Immigrants | Vietnam | 100.0 /100 | #33 | Exceptional 11.4% |
| Immigrants | Ethiopia | 100.0 /100 | #34 | Exceptional 11.4% |
| Immigrants | South Eastern Asia | 100.0 /100 | #35 | Exceptional 11.4% |
| Immigrants | Serbia | 100.0 /100 | #36 | Exceptional 11.4% |
| Immigrants | Singapore | 100.0 /100 | #37 | Exceptional 11.4% |
| Sri Lankans | 100.0 /100 | #38 | Exceptional 11.5% |
| Soviet Union | 100.0 /100 | #39 | Exceptional 11.5% |
| Immigrants | Korea | 100.0 /100 | #40 | Exceptional 11.5% |
| Immigrants | Iraq | 99.9 /100 | #41 | Exceptional 11.5% |
| Egyptians | 99.9 /100 | #42 | Exceptional 11.5% |
| Immigrants | Peru | 99.9 /100 | #43 | Exceptional 11.5% |
| Immigrants | Cameroon | 99.9 /100 | #44 | Exceptional 11.5% |
| Immigrants | Poland | 99.9 /100 | #45 | Exceptional 11.5% |
| Immigrants | Bulgaria | 99.9 /100 | #46 | Exceptional 11.6% |