Czechoslovakian vs Ottawa Single Female Poverty
COMPARE
Czechoslovakian
Ottawa
Single Female Poverty
Single Female Poverty Comparison
Czechoslovakians
Ottawa
21.3%
SINGLE FEMALE POVERTY
27.7/ 100
METRIC RATING
194th/ 347
METRIC RANK
26.0%
SINGLE FEMALE POVERTY
0.0/ 100
METRIC RATING
317th/ 347
METRIC RANK
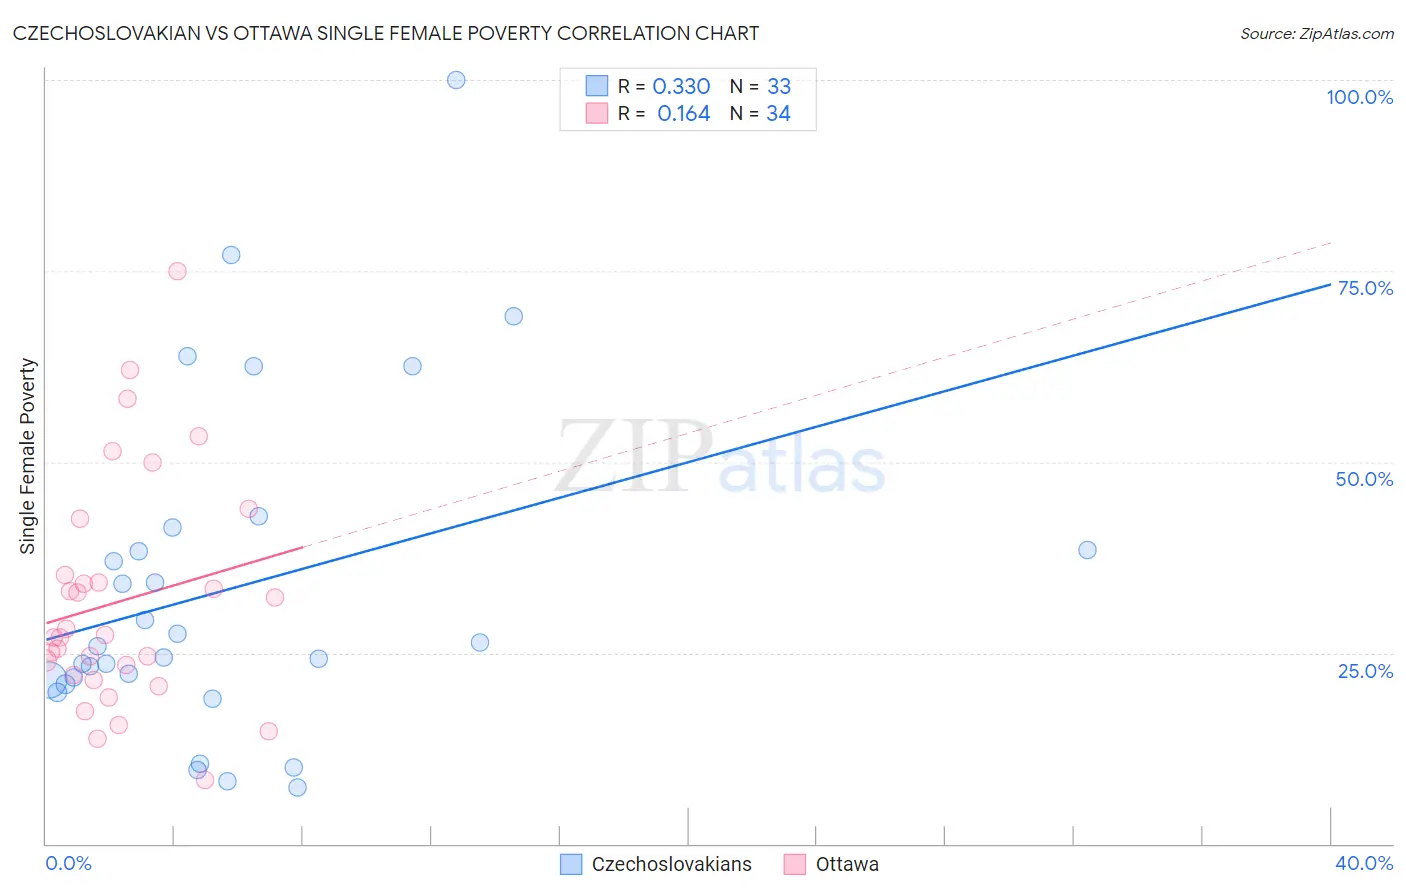
Czechoslovakian vs Ottawa Single Female Poverty Correlation Chart
The statistical analysis conducted on geographies consisting of 361,916,280 people shows a mild positive correlation between the proportion of Czechoslovakians and poverty level among single females in the United States with a correlation coefficient (R) of 0.330 and weighted average of 21.3%. Similarly, the statistical analysis conducted on geographies consisting of 49,782,789 people shows a poor positive correlation between the proportion of Ottawa and poverty level among single females in the United States with a correlation coefficient (R) of 0.164 and weighted average of 26.0%, a difference of 21.9%.
Single Female Poverty Correlation Summary
| Measurement | Czechoslovakian | Ottawa |
| Minimum | 7.4% | 8.3% |
| Maximum | 100.0% | 75.0% |
| Range | 92.6% | 66.7% |
| Mean | 33.3% | 31.8% |
| Median | 25.9% | 27.2% |
| Interquartile 25% (IQ1) | 21.1% | 22.0% |
| Interquartile 75% (IQ3) | 39.9% | 35.2% |
| Interquartile Range (IQR) | 18.8% | 13.1% |
| Standard Deviation (Sample) | 21.6% | 15.1% |
| Standard Deviation (Population) | 21.3% | 14.8% |
Similar Demographics by Single Female Poverty
Demographics Similar to Czechoslovakians by Single Female Poverty
In terms of single female poverty, the demographic groups most similar to Czechoslovakians are Nicaraguan (21.3%, a difference of 0.010%), Basque (21.3%, a difference of 0.030%), Immigrants from Saudi Arabia (21.3%, a difference of 0.050%), Japanese (21.3%, a difference of 0.10%), and Immigrants from Jamaica (21.3%, a difference of 0.21%).
| Demographics | Rating | Rank | Single Female Poverty |
| Immigrants | Nigeria | 36.8 /100 | #187 | Fair 21.2% |
| Yugoslavians | 35.4 /100 | #188 | Fair 21.2% |
| Immigrants | Cuba | 35.3 /100 | #189 | Fair 21.2% |
| Trinidadians and Tobagonians | 35.2 /100 | #190 | Fair 21.2% |
| Immigrants | Germany | 31.1 /100 | #191 | Fair 21.3% |
| Immigrants | Jamaica | 30.5 /100 | #192 | Fair 21.3% |
| Basques | 28.1 /100 | #193 | Fair 21.3% |
| Czechoslovakians | 27.7 /100 | #194 | Fair 21.3% |
| Nicaraguans | 27.6 /100 | #195 | Fair 21.3% |
| Immigrants | Saudi Arabia | 27.1 /100 | #196 | Fair 21.3% |
| Japanese | 26.4 /100 | #197 | Fair 21.3% |
| Swiss | 24.2 /100 | #198 | Fair 21.4% |
| Immigrants | Immigrants | 22.0 /100 | #199 | Fair 21.4% |
| Irish | 21.4 /100 | #200 | Fair 21.4% |
| Nigerians | 20.9 /100 | #201 | Fair 21.4% |
Demographics Similar to Ottawa by Single Female Poverty
In terms of single female poverty, the demographic groups most similar to Ottawa are Immigrants from Somalia (25.8%, a difference of 0.84%), Iroquois (25.7%, a difference of 1.0%), Chickasaw (26.3%, a difference of 1.0%), Cherokee (25.7%, a difference of 1.3%), and Black/African American (26.4%, a difference of 1.4%).
| Demographics | Rating | Rank | Single Female Poverty |
| Central American Indians | 0.0 /100 | #310 | Tragic 25.5% |
| Immigrants | Honduras | 0.0 /100 | #311 | Tragic 25.5% |
| Paiute | 0.0 /100 | #312 | Tragic 25.5% |
| Comanche | 0.0 /100 | #313 | Tragic 25.6% |
| Cherokee | 0.0 /100 | #314 | Tragic 25.7% |
| Iroquois | 0.0 /100 | #315 | Tragic 25.7% |
| Immigrants | Somalia | 0.0 /100 | #316 | Tragic 25.8% |
| Ottawa | 0.0 /100 | #317 | Tragic 26.0% |
| Chickasaw | 0.0 /100 | #318 | Tragic 26.3% |
| Blacks/African Americans | 0.0 /100 | #319 | Tragic 26.4% |
| Arapaho | 0.0 /100 | #320 | Tragic 26.4% |
| Yup'ik | 0.0 /100 | #321 | Tragic 26.6% |
| Seminole | 0.0 /100 | #322 | Tragic 26.8% |
| Chippewa | 0.0 /100 | #323 | Tragic 26.8% |
| Kiowa | 0.0 /100 | #324 | Tragic 26.9% |