Czechoslovakian vs Alaskan Athabascan Single Female Poverty
COMPARE
Czechoslovakian
Alaskan Athabascan
Single Female Poverty
Single Female Poverty Comparison
Czechoslovakians
Alaskan Athabascans
21.3%
SINGLE FEMALE POVERTY
27.7/ 100
METRIC RATING
194th/ 347
METRIC RANK
23.6%
SINGLE FEMALE POVERTY
0.0/ 100
METRIC RATING
279th/ 347
METRIC RANK
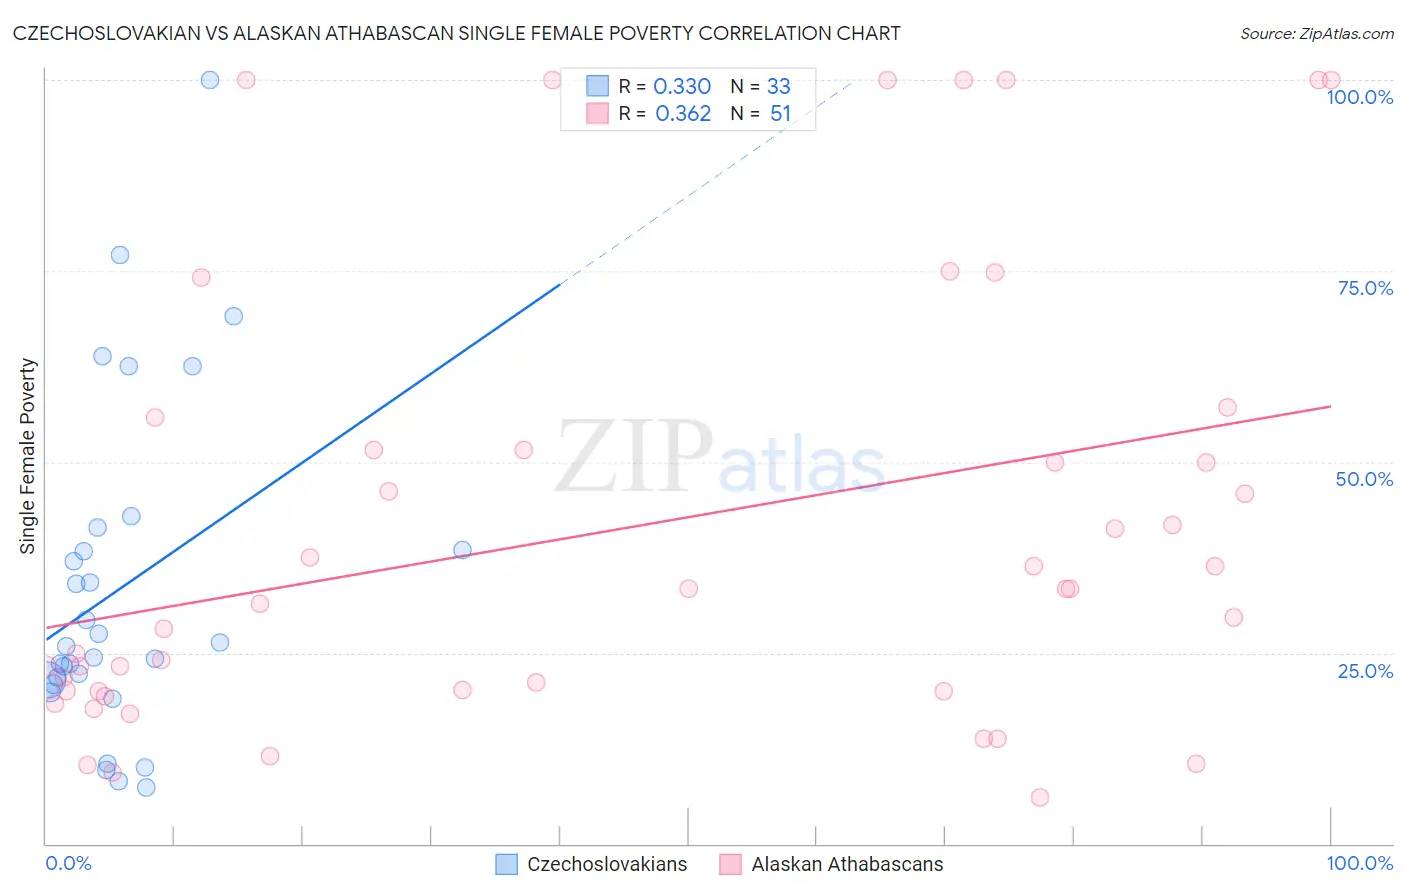
Czechoslovakian vs Alaskan Athabascan Single Female Poverty Correlation Chart
The statistical analysis conducted on geographies consisting of 361,916,280 people shows a mild positive correlation between the proportion of Czechoslovakians and poverty level among single females in the United States with a correlation coefficient (R) of 0.330 and weighted average of 21.3%. Similarly, the statistical analysis conducted on geographies consisting of 45,584,348 people shows a mild positive correlation between the proportion of Alaskan Athabascans and poverty level among single females in the United States with a correlation coefficient (R) of 0.362 and weighted average of 23.6%, a difference of 10.7%.
Single Female Poverty Correlation Summary
| Measurement | Czechoslovakian | Alaskan Athabascan |
| Minimum | 7.4% | 6.0% |
| Maximum | 100.0% | 100.0% |
| Range | 92.6% | 94.0% |
| Mean | 33.3% | 41.2% |
| Median | 25.9% | 33.3% |
| Interquartile 25% (IQ1) | 21.1% | 20.0% |
| Interquartile 75% (IQ3) | 39.9% | 51.6% |
| Interquartile Range (IQR) | 18.8% | 31.6% |
| Standard Deviation (Sample) | 21.6% | 28.9% |
| Standard Deviation (Population) | 21.3% | 28.7% |
Similar Demographics by Single Female Poverty
Demographics Similar to Czechoslovakians by Single Female Poverty
In terms of single female poverty, the demographic groups most similar to Czechoslovakians are Nicaraguan (21.3%, a difference of 0.010%), Basque (21.3%, a difference of 0.030%), Immigrants from Saudi Arabia (21.3%, a difference of 0.050%), Japanese (21.3%, a difference of 0.10%), and Immigrants from Jamaica (21.3%, a difference of 0.21%).
| Demographics | Rating | Rank | Single Female Poverty |
| Immigrants | Nigeria | 36.8 /100 | #187 | Fair 21.2% |
| Yugoslavians | 35.4 /100 | #188 | Fair 21.2% |
| Immigrants | Cuba | 35.3 /100 | #189 | Fair 21.2% |
| Trinidadians and Tobagonians | 35.2 /100 | #190 | Fair 21.2% |
| Immigrants | Germany | 31.1 /100 | #191 | Fair 21.3% |
| Immigrants | Jamaica | 30.5 /100 | #192 | Fair 21.3% |
| Basques | 28.1 /100 | #193 | Fair 21.3% |
| Czechoslovakians | 27.7 /100 | #194 | Fair 21.3% |
| Nicaraguans | 27.6 /100 | #195 | Fair 21.3% |
| Immigrants | Saudi Arabia | 27.1 /100 | #196 | Fair 21.3% |
| Japanese | 26.4 /100 | #197 | Fair 21.3% |
| Swiss | 24.2 /100 | #198 | Fair 21.4% |
| Immigrants | Immigrants | 22.0 /100 | #199 | Fair 21.4% |
| Irish | 21.4 /100 | #200 | Fair 21.4% |
| Nigerians | 20.9 /100 | #201 | Fair 21.4% |
Demographics Similar to Alaskan Athabascans by Single Female Poverty
In terms of single female poverty, the demographic groups most similar to Alaskan Athabascans are Nonimmigrants (23.6%, a difference of 0.040%), Pennsylvania German (23.6%, a difference of 0.11%), Immigrants from the Azores (23.5%, a difference of 0.27%), Immigrants from Latin America (23.7%, a difference of 0.49%), and Immigrants from Zaire (23.8%, a difference of 1.0%).
| Demographics | Rating | Rank | Single Female Poverty |
| Immigrants | Senegal | 0.1 /100 | #272 | Tragic 23.2% |
| Alaska Natives | 0.1 /100 | #273 | Tragic 23.3% |
| Marshallese | 0.1 /100 | #274 | Tragic 23.3% |
| Mexican American Indians | 0.1 /100 | #275 | Tragic 23.4% |
| Immigrants | Azores | 0.0 /100 | #276 | Tragic 23.5% |
| Pennsylvania Germans | 0.0 /100 | #277 | Tragic 23.6% |
| Immigrants | Nonimmigrants | 0.0 /100 | #278 | Tragic 23.6% |
| Alaskan Athabascans | 0.0 /100 | #279 | Tragic 23.6% |
| Immigrants | Latin America | 0.0 /100 | #280 | Tragic 23.7% |
| Immigrants | Zaire | 0.0 /100 | #281 | Tragic 23.8% |
| Guatemalans | 0.0 /100 | #282 | Tragic 23.8% |
| German Russians | 0.0 /100 | #283 | Tragic 23.9% |
| Immigrants | Dominica | 0.0 /100 | #284 | Tragic 23.9% |
| Immigrants | Guatemala | 0.0 /100 | #285 | Tragic 24.1% |
| Cree | 0.0 /100 | #286 | Tragic 24.1% |