Czechoslovakian vs Immigrants from Bosnia and Herzegovina Single Female Poverty
COMPARE
Czechoslovakian
Immigrants from Bosnia and Herzegovina
Single Female Poverty
Single Female Poverty Comparison
Czechoslovakians
Immigrants from Bosnia and Herzegovina
21.3%
SINGLE FEMALE POVERTY
27.7/ 100
METRIC RATING
194th/ 347
METRIC RANK
21.1%
SINGLE FEMALE POVERTY
44.9/ 100
METRIC RATING
178th/ 347
METRIC RANK
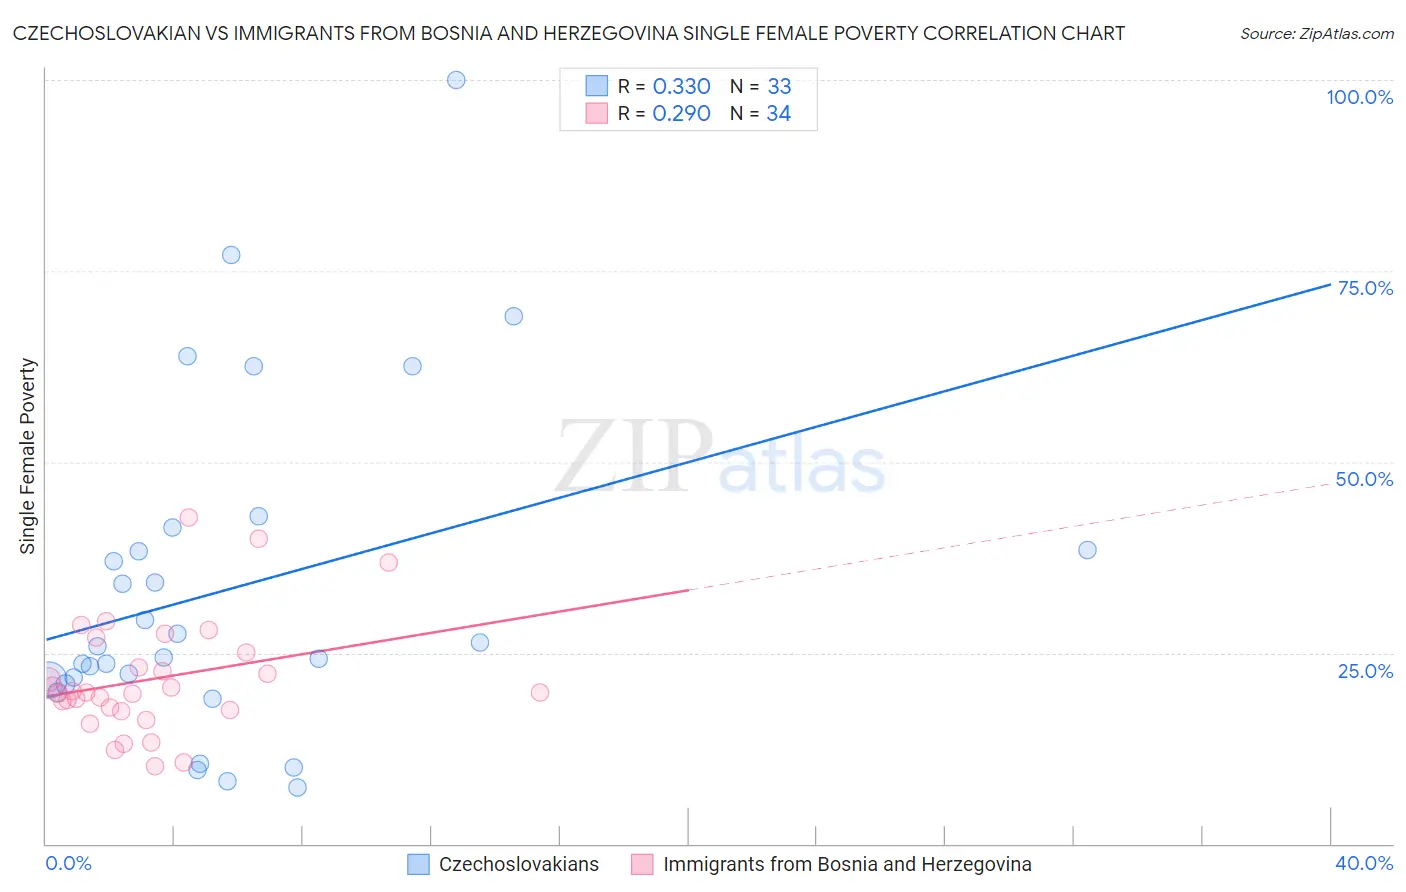
Czechoslovakian vs Immigrants from Bosnia and Herzegovina Single Female Poverty Correlation Chart
The statistical analysis conducted on geographies consisting of 361,916,280 people shows a mild positive correlation between the proportion of Czechoslovakians and poverty level among single females in the United States with a correlation coefficient (R) of 0.330 and weighted average of 21.3%. Similarly, the statistical analysis conducted on geographies consisting of 155,809,580 people shows a weak positive correlation between the proportion of Immigrants from Bosnia and Herzegovina and poverty level among single females in the United States with a correlation coefficient (R) of 0.290 and weighted average of 21.1%, a difference of 1.2%.
Single Female Poverty Correlation Summary
| Measurement | Czechoslovakian | Immigrants from Bosnia and Herzegovina |
| Minimum | 7.4% | 10.2% |
| Maximum | 100.0% | 42.7% |
| Range | 92.6% | 32.5% |
| Mean | 33.3% | 21.6% |
| Median | 25.9% | 19.8% |
| Interquartile 25% (IQ1) | 21.1% | 17.5% |
| Interquartile 75% (IQ3) | 39.9% | 25.0% |
| Interquartile Range (IQR) | 18.8% | 7.5% |
| Standard Deviation (Sample) | 21.6% | 7.5% |
| Standard Deviation (Population) | 21.3% | 7.4% |
Demographics Similar to Czechoslovakians and Immigrants from Bosnia and Herzegovina by Single Female Poverty
In terms of single female poverty, the demographic groups most similar to Czechoslovakians are Nicaraguan (21.3%, a difference of 0.010%), Basque (21.3%, a difference of 0.030%), Immigrants from Saudi Arabia (21.3%, a difference of 0.050%), Immigrants from Jamaica (21.3%, a difference of 0.21%), and Immigrants from Germany (21.3%, a difference of 0.25%). Similarly, the demographic groups most similar to Immigrants from Bosnia and Herzegovina are Scandinavian (21.1%, a difference of 0.020%), Canadian (21.1%, a difference of 0.040%), British (21.1%, a difference of 0.12%), Spanish American Indian (21.1%, a difference of 0.15%), and European (21.1%, a difference of 0.16%).
| Demographics | Rating | Rank | Single Female Poverty |
| Canadians | 45.4 /100 | #176 | Average 21.1% |
| Scandinavians | 45.2 /100 | #177 | Average 21.1% |
| Immigrants | Bosnia and Herzegovina | 44.9 /100 | #178 | Average 21.1% |
| British | 42.9 /100 | #179 | Average 21.1% |
| Spanish American Indians | 42.5 /100 | #180 | Average 21.1% |
| Europeans | 42.3 /100 | #181 | Average 21.1% |
| Slavs | 40.5 /100 | #182 | Average 21.1% |
| Slovaks | 39.7 /100 | #183 | Fair 21.1% |
| Hungarians | 39.6 /100 | #184 | Fair 21.1% |
| Immigrants | Cambodia | 38.2 /100 | #185 | Fair 21.2% |
| Hawaiians | 37.7 /100 | #186 | Fair 21.2% |
| Immigrants | Nigeria | 36.8 /100 | #187 | Fair 21.2% |
| Yugoslavians | 35.4 /100 | #188 | Fair 21.2% |
| Immigrants | Cuba | 35.3 /100 | #189 | Fair 21.2% |
| Trinidadians and Tobagonians | 35.2 /100 | #190 | Fair 21.2% |
| Immigrants | Germany | 31.1 /100 | #191 | Fair 21.3% |
| Immigrants | Jamaica | 30.5 /100 | #192 | Fair 21.3% |
| Basques | 28.1 /100 | #193 | Fair 21.3% |
| Czechoslovakians | 27.7 /100 | #194 | Fair 21.3% |
| Nicaraguans | 27.6 /100 | #195 | Fair 21.3% |
| Immigrants | Saudi Arabia | 27.1 /100 | #196 | Fair 21.3% |