New Zealander vs Ottawa Single Female Poverty
COMPARE
New Zealander
Ottawa
Single Female Poverty
Single Female Poverty Comparison
New Zealanders
Ottawa
21.0%
SINGLE FEMALE POVERTY
53.2/ 100
METRIC RATING
170th/ 347
METRIC RANK
26.0%
SINGLE FEMALE POVERTY
0.0/ 100
METRIC RATING
317th/ 347
METRIC RANK
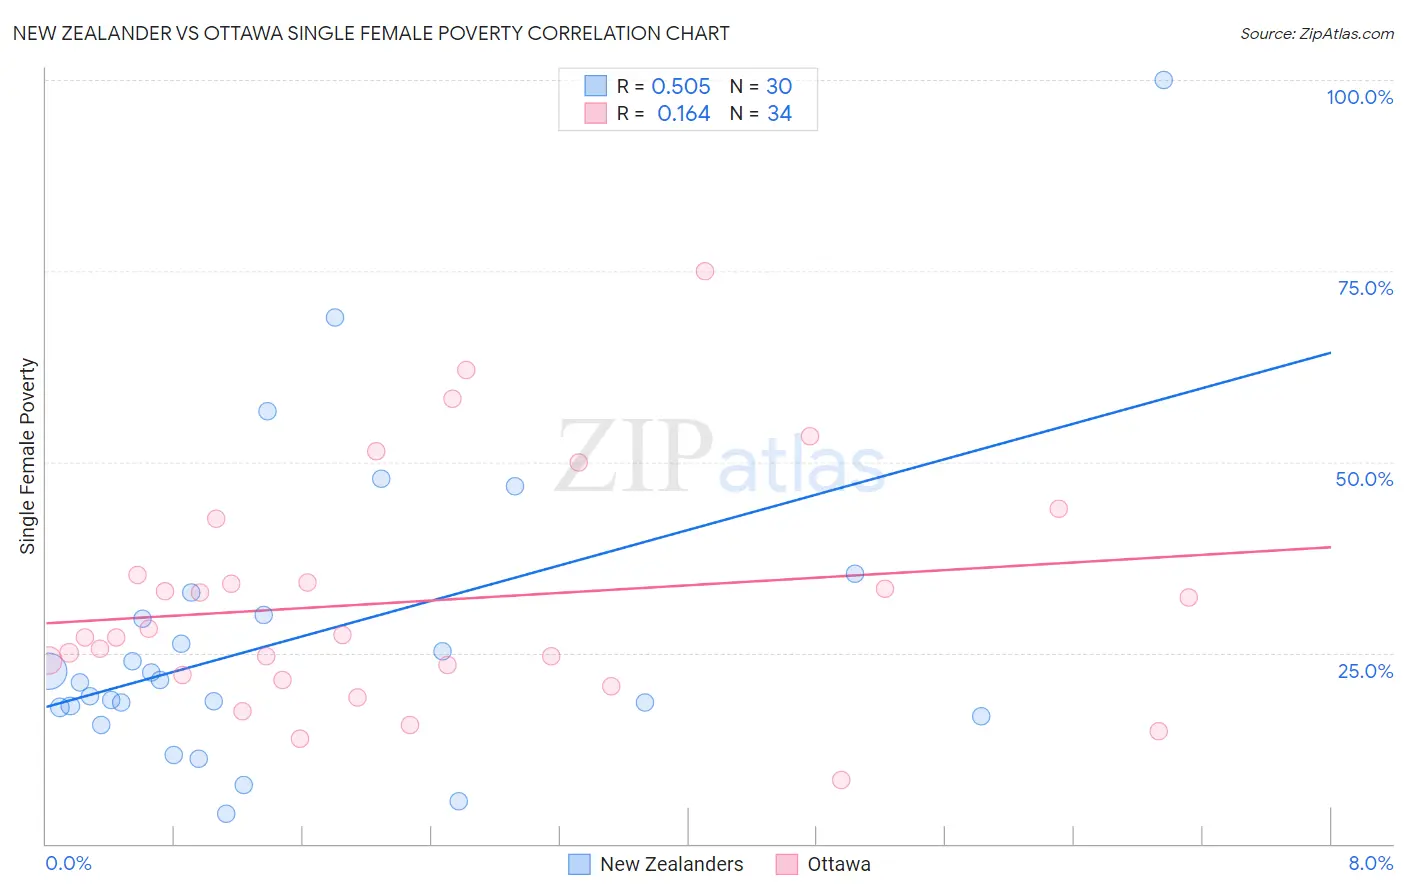
New Zealander vs Ottawa Single Female Poverty Correlation Chart
The statistical analysis conducted on geographies consisting of 106,229,490 people shows a substantial positive correlation between the proportion of New Zealanders and poverty level among single females in the United States with a correlation coefficient (R) of 0.505 and weighted average of 21.0%. Similarly, the statistical analysis conducted on geographies consisting of 49,782,789 people shows a poor positive correlation between the proportion of Ottawa and poverty level among single females in the United States with a correlation coefficient (R) of 0.164 and weighted average of 26.0%, a difference of 24.0%.
Single Female Poverty Correlation Summary
| Measurement | New Zealander | Ottawa |
| Minimum | 3.9% | 8.3% |
| Maximum | 100.0% | 75.0% |
| Range | 96.1% | 66.7% |
| Mean | 27.1% | 31.8% |
| Median | 21.3% | 27.2% |
| Interquartile 25% (IQ1) | 17.8% | 22.0% |
| Interquartile 75% (IQ3) | 29.9% | 35.2% |
| Interquartile Range (IQR) | 12.0% | 13.1% |
| Standard Deviation (Sample) | 20.0% | 15.1% |
| Standard Deviation (Population) | 19.7% | 14.8% |
Similar Demographics by Single Female Poverty
Demographics Similar to New Zealanders by Single Female Poverty
In terms of single female poverty, the demographic groups most similar to New Zealanders are Moroccan (21.0%, a difference of 0.020%), Guyanese (21.0%, a difference of 0.070%), Immigrants from Guyana (21.0%, a difference of 0.16%), Immigrants from Trinidad and Tobago (20.9%, a difference of 0.20%), and Cuban (21.0%, a difference of 0.20%).
| Demographics | Rating | Rank | Single Female Poverty |
| Lebanese | 67.6 /100 | #163 | Good 20.8% |
| Iraqis | 64.5 /100 | #164 | Good 20.8% |
| Ugandans | 64.0 /100 | #165 | Good 20.8% |
| Norwegians | 63.0 /100 | #166 | Good 20.8% |
| Immigrants | Norway | 63.0 /100 | #167 | Good 20.8% |
| Immigrants | Costa Rica | 61.5 /100 | #168 | Good 20.9% |
| Immigrants | Trinidad and Tobago | 56.3 /100 | #169 | Average 20.9% |
| New Zealanders | 53.2 /100 | #170 | Average 21.0% |
| Moroccans | 52.8 /100 | #171 | Average 21.0% |
| Guyanese | 52.0 /100 | #172 | Average 21.0% |
| Immigrants | Guyana | 50.6 /100 | #173 | Average 21.0% |
| Cubans | 50.0 /100 | #174 | Average 21.0% |
| Czechs | 46.8 /100 | #175 | Average 21.0% |
| Canadians | 45.4 /100 | #176 | Average 21.1% |
| Scandinavians | 45.2 /100 | #177 | Average 21.1% |
Demographics Similar to Ottawa by Single Female Poverty
In terms of single female poverty, the demographic groups most similar to Ottawa are Immigrants from Somalia (25.8%, a difference of 0.84%), Iroquois (25.7%, a difference of 1.0%), Chickasaw (26.3%, a difference of 1.0%), Cherokee (25.7%, a difference of 1.3%), and Black/African American (26.4%, a difference of 1.4%).
| Demographics | Rating | Rank | Single Female Poverty |
| Central American Indians | 0.0 /100 | #310 | Tragic 25.5% |
| Immigrants | Honduras | 0.0 /100 | #311 | Tragic 25.5% |
| Paiute | 0.0 /100 | #312 | Tragic 25.5% |
| Comanche | 0.0 /100 | #313 | Tragic 25.6% |
| Cherokee | 0.0 /100 | #314 | Tragic 25.7% |
| Iroquois | 0.0 /100 | #315 | Tragic 25.7% |
| Immigrants | Somalia | 0.0 /100 | #316 | Tragic 25.8% |
| Ottawa | 0.0 /100 | #317 | Tragic 26.0% |
| Chickasaw | 0.0 /100 | #318 | Tragic 26.3% |
| Blacks/African Americans | 0.0 /100 | #319 | Tragic 26.4% |
| Arapaho | 0.0 /100 | #320 | Tragic 26.4% |
| Yup'ik | 0.0 /100 | #321 | Tragic 26.6% |
| Seminole | 0.0 /100 | #322 | Tragic 26.8% |
| Chippewa | 0.0 /100 | #323 | Tragic 26.8% |
| Kiowa | 0.0 /100 | #324 | Tragic 26.9% |