Czechoslovakian vs Immigrants from Yemen Single Female Poverty
COMPARE
Czechoslovakian
Immigrants from Yemen
Single Female Poverty
Single Female Poverty Comparison
Czechoslovakians
Immigrants from Yemen
21.3%
SINGLE FEMALE POVERTY
27.7/ 100
METRIC RATING
194th/ 347
METRIC RANK
28.9%
SINGLE FEMALE POVERTY
0.0/ 100
METRIC RATING
335th/ 347
METRIC RANK
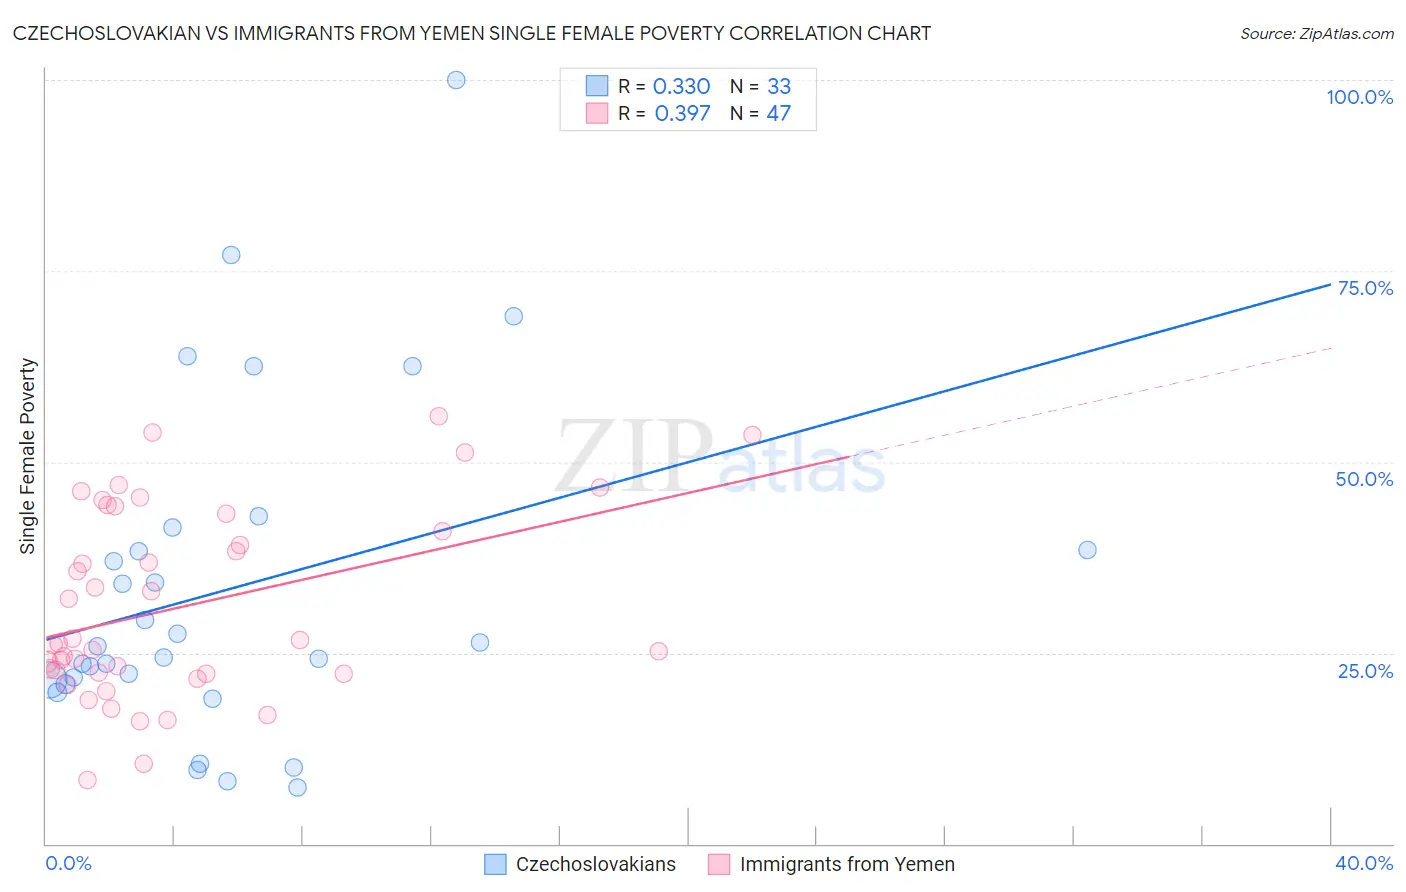
Czechoslovakian vs Immigrants from Yemen Single Female Poverty Correlation Chart
The statistical analysis conducted on geographies consisting of 361,916,280 people shows a mild positive correlation between the proportion of Czechoslovakians and poverty level among single females in the United States with a correlation coefficient (R) of 0.330 and weighted average of 21.3%. Similarly, the statistical analysis conducted on geographies consisting of 82,238,204 people shows a mild positive correlation between the proportion of Immigrants from Yemen and poverty level among single females in the United States with a correlation coefficient (R) of 0.397 and weighted average of 28.9%, a difference of 35.7%.
Single Female Poverty Correlation Summary
| Measurement | Czechoslovakian | Immigrants from Yemen |
| Minimum | 7.4% | 8.3% |
| Maximum | 100.0% | 56.0% |
| Range | 92.6% | 47.7% |
| Mean | 33.3% | 31.0% |
| Median | 25.9% | 26.2% |
| Interquartile 25% (IQ1) | 21.1% | 22.3% |
| Interquartile 75% (IQ3) | 39.9% | 43.3% |
| Interquartile Range (IQR) | 18.8% | 20.9% |
| Standard Deviation (Sample) | 21.6% | 12.3% |
| Standard Deviation (Population) | 21.3% | 12.2% |
Similar Demographics by Single Female Poverty
Demographics Similar to Czechoslovakians by Single Female Poverty
In terms of single female poverty, the demographic groups most similar to Czechoslovakians are Nicaraguan (21.3%, a difference of 0.010%), Basque (21.3%, a difference of 0.030%), Immigrants from Saudi Arabia (21.3%, a difference of 0.050%), Japanese (21.3%, a difference of 0.10%), and Immigrants from Jamaica (21.3%, a difference of 0.21%).
| Demographics | Rating | Rank | Single Female Poverty |
| Immigrants | Nigeria | 36.8 /100 | #187 | Fair 21.2% |
| Yugoslavians | 35.4 /100 | #188 | Fair 21.2% |
| Immigrants | Cuba | 35.3 /100 | #189 | Fair 21.2% |
| Trinidadians and Tobagonians | 35.2 /100 | #190 | Fair 21.2% |
| Immigrants | Germany | 31.1 /100 | #191 | Fair 21.3% |
| Immigrants | Jamaica | 30.5 /100 | #192 | Fair 21.3% |
| Basques | 28.1 /100 | #193 | Fair 21.3% |
| Czechoslovakians | 27.7 /100 | #194 | Fair 21.3% |
| Nicaraguans | 27.6 /100 | #195 | Fair 21.3% |
| Immigrants | Saudi Arabia | 27.1 /100 | #196 | Fair 21.3% |
| Japanese | 26.4 /100 | #197 | Fair 21.3% |
| Swiss | 24.2 /100 | #198 | Fair 21.4% |
| Immigrants | Immigrants | 22.0 /100 | #199 | Fair 21.4% |
| Irish | 21.4 /100 | #200 | Fair 21.4% |
| Nigerians | 20.9 /100 | #201 | Fair 21.4% |
Demographics Similar to Immigrants from Yemen by Single Female Poverty
In terms of single female poverty, the demographic groups most similar to Immigrants from Yemen are Colville (29.1%, a difference of 0.49%), Pueblo (28.6%, a difference of 1.1%), Yuman (29.4%, a difference of 1.8%), Ute (28.4%, a difference of 1.9%), and Yakama (28.3%, a difference of 2.3%).
| Demographics | Rating | Rank | Single Female Poverty |
| Apache | 0.0 /100 | #328 | Tragic 27.7% |
| Menominee | 0.0 /100 | #329 | Tragic 27.8% |
| Hopi | 0.0 /100 | #330 | Tragic 28.0% |
| Natives/Alaskans | 0.0 /100 | #331 | Tragic 28.2% |
| Yakama | 0.0 /100 | #332 | Tragic 28.3% |
| Ute | 0.0 /100 | #333 | Tragic 28.4% |
| Pueblo | 0.0 /100 | #334 | Tragic 28.6% |
| Immigrants | Yemen | 0.0 /100 | #335 | Tragic 28.9% |
| Colville | 0.0 /100 | #336 | Tragic 29.1% |
| Yuman | 0.0 /100 | #337 | Tragic 29.4% |
| Pima | 0.0 /100 | #338 | Tragic 30.3% |
| Cheyenne | 0.0 /100 | #339 | Tragic 30.4% |
| Cajuns | 0.0 /100 | #340 | Tragic 30.6% |
| Sioux | 0.0 /100 | #341 | Tragic 31.3% |
| Navajo | 0.0 /100 | #342 | Tragic 31.7% |