Czechoslovakian vs Ottawa Disability Age Under 5
COMPARE
Czechoslovakian
Ottawa
Disability Age Under 5
Disability Age Under 5 Comparison
Czechoslovakians
Ottawa
1.5%
DISABILITY AGE UNDER 5
0.0/ 100
METRIC RATING
281st/ 347
METRIC RANK
1.7%
DISABILITY AGE UNDER 5
0.0/ 100
METRIC RATING
321st/ 347
METRIC RANK
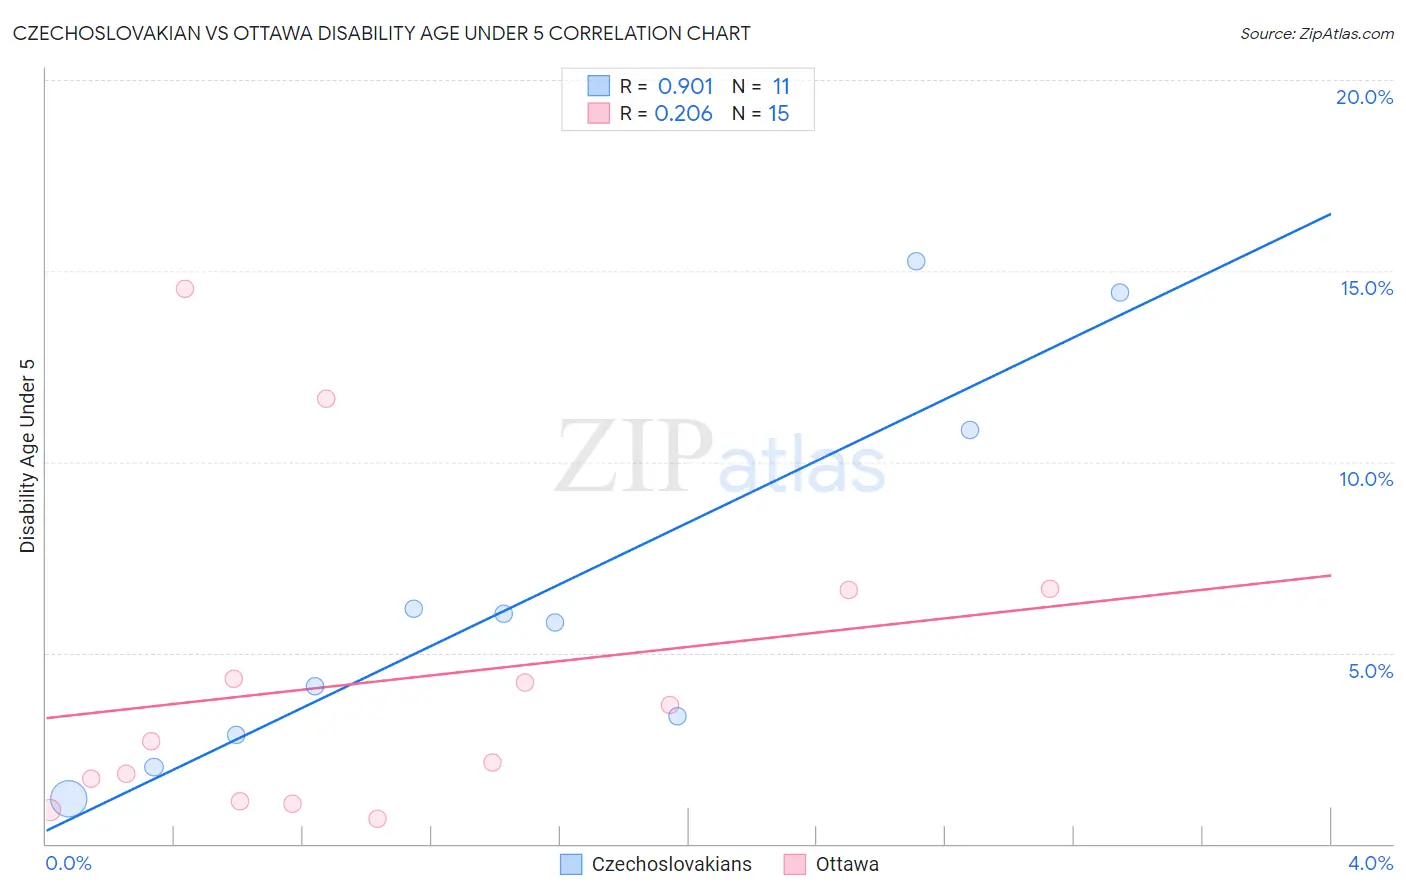
Czechoslovakian vs Ottawa Disability Age Under 5 Correlation Chart
The statistical analysis conducted on geographies consisting of 199,678,332 people shows a near-perfect positive correlation between the proportion of Czechoslovakians and percentage of population with a disability under the age of 5 in the United States with a correlation coefficient (R) of 0.901 and weighted average of 1.5%. Similarly, the statistical analysis conducted on geographies consisting of 39,604,340 people shows a weak positive correlation between the proportion of Ottawa and percentage of population with a disability under the age of 5 in the United States with a correlation coefficient (R) of 0.206 and weighted average of 1.7%, a difference of 13.2%.
Disability Age Under 5 Correlation Summary
| Measurement | Czechoslovakian | Ottawa |
| Minimum | 1.2% | 0.66% |
| Maximum | 15.3% | 14.5% |
| Range | 14.1% | 13.9% |
| Mean | 6.5% | 4.3% |
| Median | 5.8% | 2.7% |
| Interquartile 25% (IQ1) | 2.8% | 1.1% |
| Interquartile 75% (IQ3) | 10.8% | 6.6% |
| Interquartile Range (IQR) | 8.0% | 5.5% |
| Standard Deviation (Sample) | 4.9% | 4.1% |
| Standard Deviation (Population) | 4.6% | 4.0% |
Similar Demographics by Disability Age Under 5
Demographics Similar to Czechoslovakians by Disability Age Under 5
In terms of disability age under 5, the demographic groups most similar to Czechoslovakians are Cheyenne (1.5%, a difference of 0.34%), Delaware (1.5%, a difference of 0.54%), European (1.5%, a difference of 0.59%), British (1.5%, a difference of 1.7%), and Croatian (1.5%, a difference of 1.8%).
| Demographics | Rating | Rank | Disability Age Under 5 |
| Iroquois | 0.0 /100 | #274 | Tragic 1.5% |
| Brazilians | 0.0 /100 | #275 | Tragic 1.5% |
| Greeks | 0.0 /100 | #276 | Tragic 1.5% |
| Canadians | 0.0 /100 | #277 | Tragic 1.5% |
| Kiowa | 0.0 /100 | #278 | Tragic 1.5% |
| Danes | 0.0 /100 | #279 | Tragic 1.5% |
| British | 0.0 /100 | #280 | Tragic 1.5% |
| Czechoslovakians | 0.0 /100 | #281 | Tragic 1.5% |
| Cheyenne | 0.0 /100 | #282 | Tragic 1.5% |
| Delaware | 0.0 /100 | #283 | Tragic 1.5% |
| Europeans | 0.0 /100 | #284 | Tragic 1.5% |
| Croatians | 0.0 /100 | #285 | Tragic 1.5% |
| Tlingit-Haida | 0.0 /100 | #286 | Tragic 1.5% |
| Scandinavians | 0.0 /100 | #287 | Tragic 1.5% |
| Estonians | 0.0 /100 | #288 | Tragic 1.5% |
Demographics Similar to Ottawa by Disability Age Under 5
In terms of disability age under 5, the demographic groups most similar to Ottawa are Scotch-Irish (1.7%, a difference of 0.060%), German (1.7%, a difference of 0.57%), Slovak (1.7%, a difference of 0.59%), Irish (1.7%, a difference of 0.89%), and French (1.7%, a difference of 1.2%).
| Demographics | Rating | Rank | Disability Age Under 5 |
| Norwegians | 0.0 /100 | #314 | Tragic 1.7% |
| Dutch | 0.0 /100 | #315 | Tragic 1.7% |
| Immigrants | Cabo Verde | 0.0 /100 | #316 | Tragic 1.7% |
| French | 0.0 /100 | #317 | Tragic 1.7% |
| Irish | 0.0 /100 | #318 | Tragic 1.7% |
| Slovaks | 0.0 /100 | #319 | Tragic 1.7% |
| Scotch-Irish | 0.0 /100 | #320 | Tragic 1.7% |
| Ottawa | 0.0 /100 | #321 | Tragic 1.7% |
| Germans | 0.0 /100 | #322 | Tragic 1.7% |
| Chickasaw | 0.0 /100 | #323 | Tragic 1.7% |
| Cherokee | 0.0 /100 | #324 | Tragic 1.8% |
| Immigrants | Portugal | 0.0 /100 | #325 | Tragic 1.8% |
| Sioux | 0.0 /100 | #326 | Tragic 1.8% |
| Osage | 0.0 /100 | #327 | Tragic 1.8% |
| Americans | 0.0 /100 | #328 | Tragic 1.9% |