Okinawan vs Chilean Family Poverty
COMPARE
Okinawan
Chilean
Family Poverty
Family Poverty Comparison
Okinawans
Chileans
7.7%
FAMILY POVERTY
98.9/ 100
METRIC RATING
45th/ 347
METRIC RANK
8.5%
FAMILY POVERTY
86.6/ 100
METRIC RATING
134th/ 347
METRIC RANK
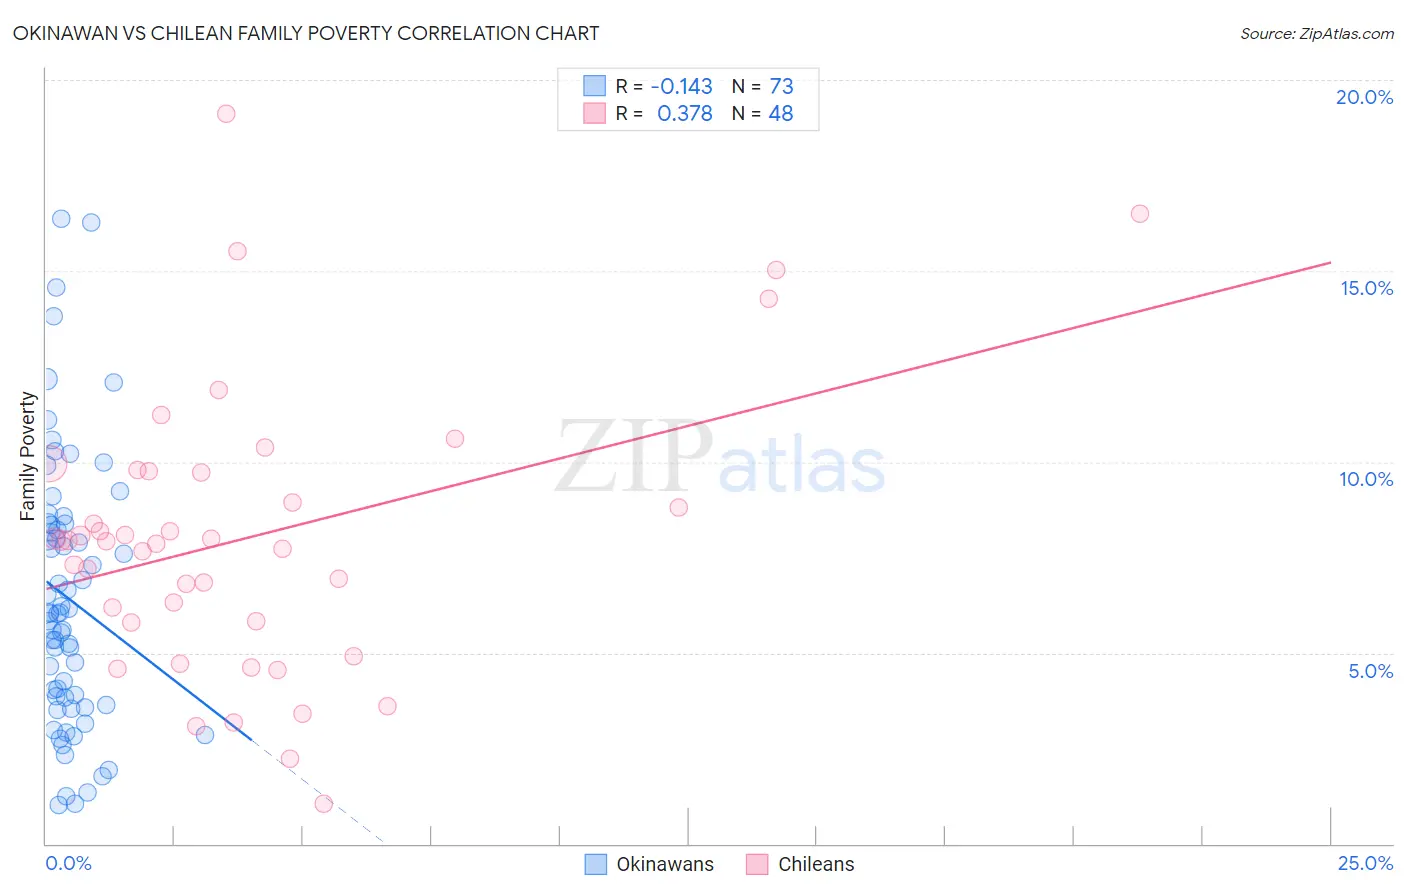
Okinawan vs Chilean Family Poverty Correlation Chart
The statistical analysis conducted on geographies consisting of 73,642,678 people shows a poor negative correlation between the proportion of Okinawans and poverty level among families in the United States with a correlation coefficient (R) of -0.143 and weighted average of 7.7%. Similarly, the statistical analysis conducted on geographies consisting of 256,264,406 people shows a mild positive correlation between the proportion of Chileans and poverty level among families in the United States with a correlation coefficient (R) of 0.378 and weighted average of 8.5%, a difference of 10.3%.
Family Poverty Correlation Summary
| Measurement | Okinawan | Chilean |
| Minimum | 1.0% | 1.0% |
| Maximum | 16.4% | 19.1% |
| Range | 15.4% | 18.1% |
| Mean | 6.4% | 8.0% |
| Median | 6.0% | 7.9% |
| Interquartile 25% (IQ1) | 3.7% | 5.8% |
| Interquartile 75% (IQ3) | 8.4% | 9.7% |
| Interquartile Range (IQR) | 4.6% | 3.9% |
| Standard Deviation (Sample) | 3.5% | 3.7% |
| Standard Deviation (Population) | 3.5% | 3.6% |
Similar Demographics by Family Poverty
Demographics Similar to Okinawans by Family Poverty
In terms of family poverty, the demographic groups most similar to Okinawans are Tongan (7.7%, a difference of 0.010%), Immigrants from Czechoslovakia (7.7%, a difference of 0.030%), Immigrants from Sri Lanka (7.7%, a difference of 0.040%), German (7.7%, a difference of 0.12%), and Immigrants from Bolivia (7.7%, a difference of 0.23%).
| Demographics | Rating | Rank | Family Poverty |
| Bolivians | 99.3 /100 | #38 | Exceptional 7.5% |
| Carpatho Rusyns | 99.3 /100 | #39 | Exceptional 7.5% |
| Slovenes | 99.3 /100 | #40 | Exceptional 7.5% |
| Immigrants | Australia | 99.2 /100 | #41 | Exceptional 7.6% |
| Scandinavians | 99.1 /100 | #42 | Exceptional 7.6% |
| Immigrants | Austria | 99.1 /100 | #43 | Exceptional 7.6% |
| Germans | 99.0 /100 | #44 | Exceptional 7.7% |
| Okinawans | 98.9 /100 | #45 | Exceptional 7.7% |
| Tongans | 98.9 /100 | #46 | Exceptional 7.7% |
| Immigrants | Czechoslovakia | 98.9 /100 | #47 | Exceptional 7.7% |
| Immigrants | Sri Lanka | 98.9 /100 | #48 | Exceptional 7.7% |
| Immigrants | Bolivia | 98.9 /100 | #49 | Exceptional 7.7% |
| Immigrants | North Macedonia | 98.9 /100 | #50 | Exceptional 7.7% |
| Immigrants | Moldova | 98.8 /100 | #51 | Exceptional 7.7% |
| Indians (Asian) | 98.8 /100 | #52 | Exceptional 7.7% |
Demographics Similar to Chileans by Family Poverty
In terms of family poverty, the demographic groups most similar to Chileans are Sri Lankan (8.5%, a difference of 0.010%), Immigrants from Malaysia (8.5%, a difference of 0.040%), Immigrants from Brazil (8.5%, a difference of 0.080%), Immigrants from Southern Europe (8.5%, a difference of 0.16%), and Immigrants from Argentina (8.4%, a difference of 0.51%).
| Demographics | Rating | Rank | Family Poverty |
| Immigrants | Hungary | 89.9 /100 | #127 | Excellent 8.4% |
| Argentineans | 89.6 /100 | #128 | Excellent 8.4% |
| Portuguese | 89.2 /100 | #129 | Excellent 8.4% |
| Immigrants | Bosnia and Herzegovina | 88.6 /100 | #130 | Excellent 8.4% |
| Puget Sound Salish | 88.6 /100 | #131 | Excellent 8.4% |
| Immigrants | Argentina | 88.2 /100 | #132 | Excellent 8.4% |
| Sri Lankans | 86.6 /100 | #133 | Excellent 8.5% |
| Chileans | 86.6 /100 | #134 | Excellent 8.5% |
| Immigrants | Malaysia | 86.5 /100 | #135 | Excellent 8.5% |
| Immigrants | Brazil | 86.3 /100 | #136 | Excellent 8.5% |
| Immigrants | Southern Europe | 86.0 /100 | #137 | Excellent 8.5% |
| Armenians | 84.6 /100 | #138 | Excellent 8.5% |
| Immigrants | Nepal | 84.2 /100 | #139 | Excellent 8.5% |
| Immigrants | Kazakhstan | 84.1 /100 | #140 | Excellent 8.5% |
| Immigrants | Ukraine | 83.9 /100 | #141 | Excellent 8.5% |