Cuban vs Chilean 5th Grade
COMPARE
Cuban
Chilean
5th Grade
5th Grade Comparison
Cubans
Chileans
96.6%
5TH GRADE
0.1/ 100
METRIC RATING
276th/ 347
METRIC RANK
97.3%
5TH GRADE
54.5/ 100
METRIC RATING
168th/ 347
METRIC RANK
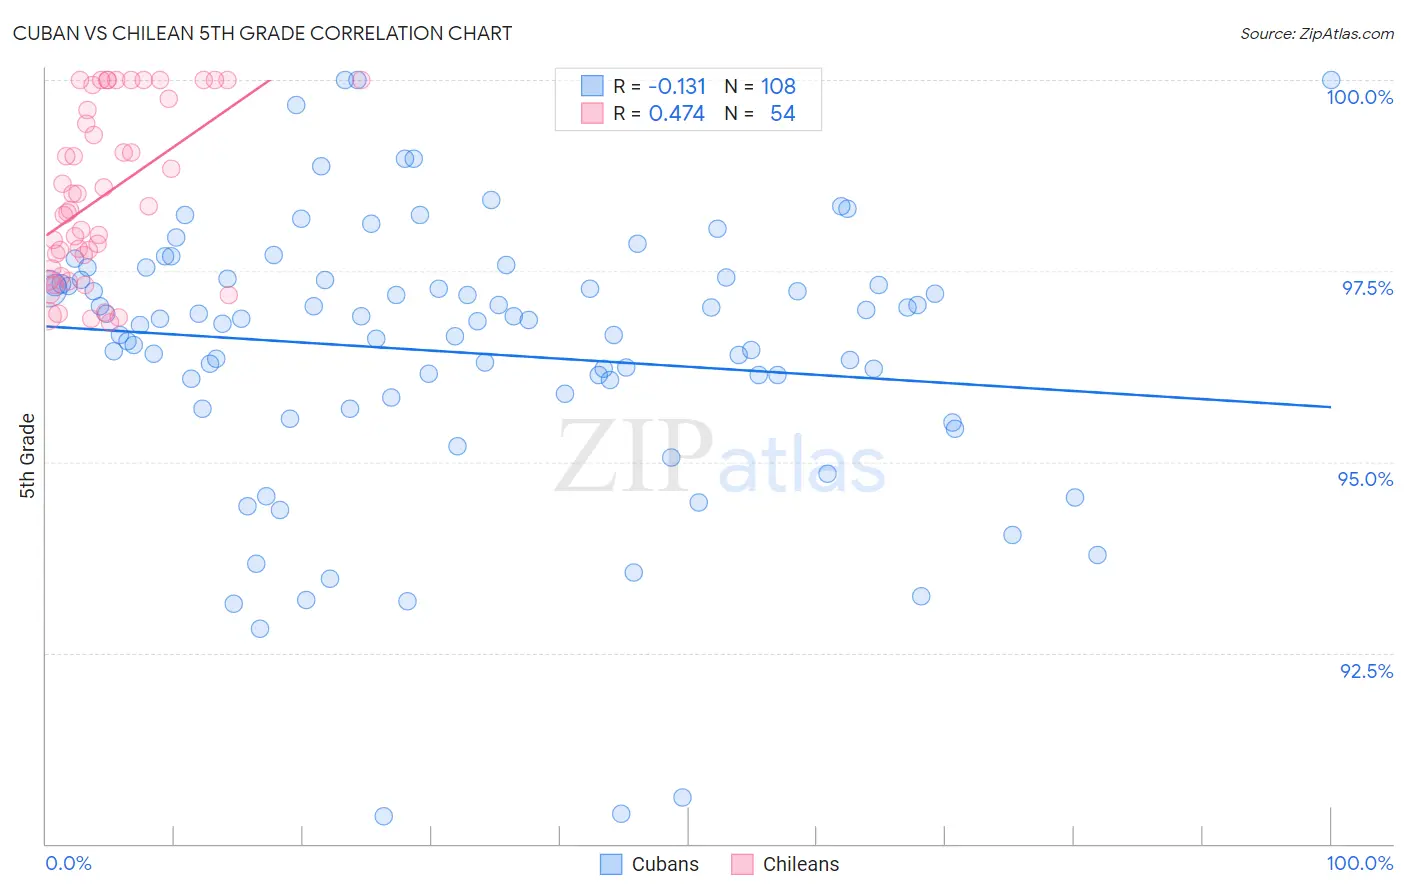
Cuban vs Chilean 5th Grade Correlation Chart
The statistical analysis conducted on geographies consisting of 449,326,865 people shows a poor negative correlation between the proportion of Cubans and percentage of population with at least 5th grade education in the United States with a correlation coefficient (R) of -0.131 and weighted average of 96.6%. Similarly, the statistical analysis conducted on geographies consisting of 256,683,580 people shows a moderate positive correlation between the proportion of Chileans and percentage of population with at least 5th grade education in the United States with a correlation coefficient (R) of 0.474 and weighted average of 97.3%, a difference of 0.73%.
5th Grade Correlation Summary
| Measurement | Cuban | Chilean |
| Minimum | 90.4% | 96.8% |
| Maximum | 100.0% | 100.0% |
| Range | 9.6% | 3.2% |
| Mean | 96.4% | 98.5% |
| Median | 96.9% | 98.3% |
| Interquartile 25% (IQ1) | 95.9% | 97.5% |
| Interquartile 75% (IQ3) | 97.4% | 99.8% |
| Interquartile Range (IQR) | 1.5% | 2.2% |
| Standard Deviation (Sample) | 1.8% | 1.1% |
| Standard Deviation (Population) | 1.8% | 1.1% |
Similar Demographics by 5th Grade
Demographics Similar to Cubans by 5th Grade
In terms of 5th grade, the demographic groups most similar to Cubans are Immigrants from Peru (96.6%, a difference of 0.0%), Immigrants from Bolivia (96.6%, a difference of 0.0%), Yaqui (96.7%, a difference of 0.010%), Immigrants from Cameroon (96.7%, a difference of 0.010%), and Immigrants from Ghana (96.6%, a difference of 0.010%).
| Demographics | Rating | Rank | 5th Grade |
| Ghanaians | 0.2 /100 | #269 | Tragic 96.7% |
| Afghans | 0.2 /100 | #270 | Tragic 96.7% |
| Immigrants | Hong Kong | 0.2 /100 | #271 | Tragic 96.7% |
| Trinidadians and Tobagonians | 0.1 /100 | #272 | Tragic 96.7% |
| Yaqui | 0.1 /100 | #273 | Tragic 96.7% |
| Immigrants | Cameroon | 0.1 /100 | #274 | Tragic 96.7% |
| Immigrants | Peru | 0.1 /100 | #275 | Tragic 96.6% |
| Cubans | 0.1 /100 | #276 | Tragic 96.6% |
| Immigrants | Bolivia | 0.1 /100 | #277 | Tragic 96.6% |
| Immigrants | Ghana | 0.1 /100 | #278 | Tragic 96.6% |
| Immigrants | Philippines | 0.1 /100 | #279 | Tragic 96.6% |
| Immigrants | Western Africa | 0.1 /100 | #280 | Tragic 96.6% |
| Houma | 0.1 /100 | #281 | Tragic 96.6% |
| Barbadians | 0.1 /100 | #282 | Tragic 96.6% |
| Fijians | 0.1 /100 | #283 | Tragic 96.6% |
Demographics Similar to Chileans by 5th Grade
In terms of 5th grade, the demographic groups most similar to Chileans are Immigrants from Belarus (97.3%, a difference of 0.0%), Immigrants from Korea (97.3%, a difference of 0.0%), Venezuelan (97.3%, a difference of 0.0%), Immigrants from Sri Lanka (97.3%, a difference of 0.0%), and Arab (97.3%, a difference of 0.0%).
| Demographics | Rating | Rank | 5th Grade |
| Kenyans | 59.7 /100 | #161 | Average 97.4% |
| Immigrants | Iran | 59.5 /100 | #162 | Average 97.4% |
| Ugandans | 58.9 /100 | #163 | Average 97.4% |
| Bermudans | 58.8 /100 | #164 | Average 97.4% |
| Immigrants | Poland | 57.9 /100 | #165 | Average 97.4% |
| Apache | 57.2 /100 | #166 | Average 97.4% |
| Immigrants | Belarus | 54.6 /100 | #167 | Average 97.3% |
| Chileans | 54.5 /100 | #168 | Average 97.3% |
| Immigrants | Korea | 54.1 /100 | #169 | Average 97.3% |
| Venezuelans | 54.0 /100 | #170 | Average 97.3% |
| Immigrants | Sri Lanka | 53.8 /100 | #171 | Average 97.3% |
| Arabs | 53.4 /100 | #172 | Average 97.3% |
| Egyptians | 52.4 /100 | #173 | Average 97.3% |
| Immigrants | Kazakhstan | 50.0 /100 | #174 | Average 97.3% |
| Immigrants | Micronesia | 48.8 /100 | #175 | Average 97.3% |