Uruguayan vs Chilean Family Poverty
COMPARE
Uruguayan
Chilean
Family Poverty
Family Poverty Comparison
Uruguayans
Chileans
9.1%
FAMILY POVERTY
39.2/ 100
METRIC RATING
183rd/ 347
METRIC RANK
8.5%
FAMILY POVERTY
86.6/ 100
METRIC RATING
134th/ 347
METRIC RANK
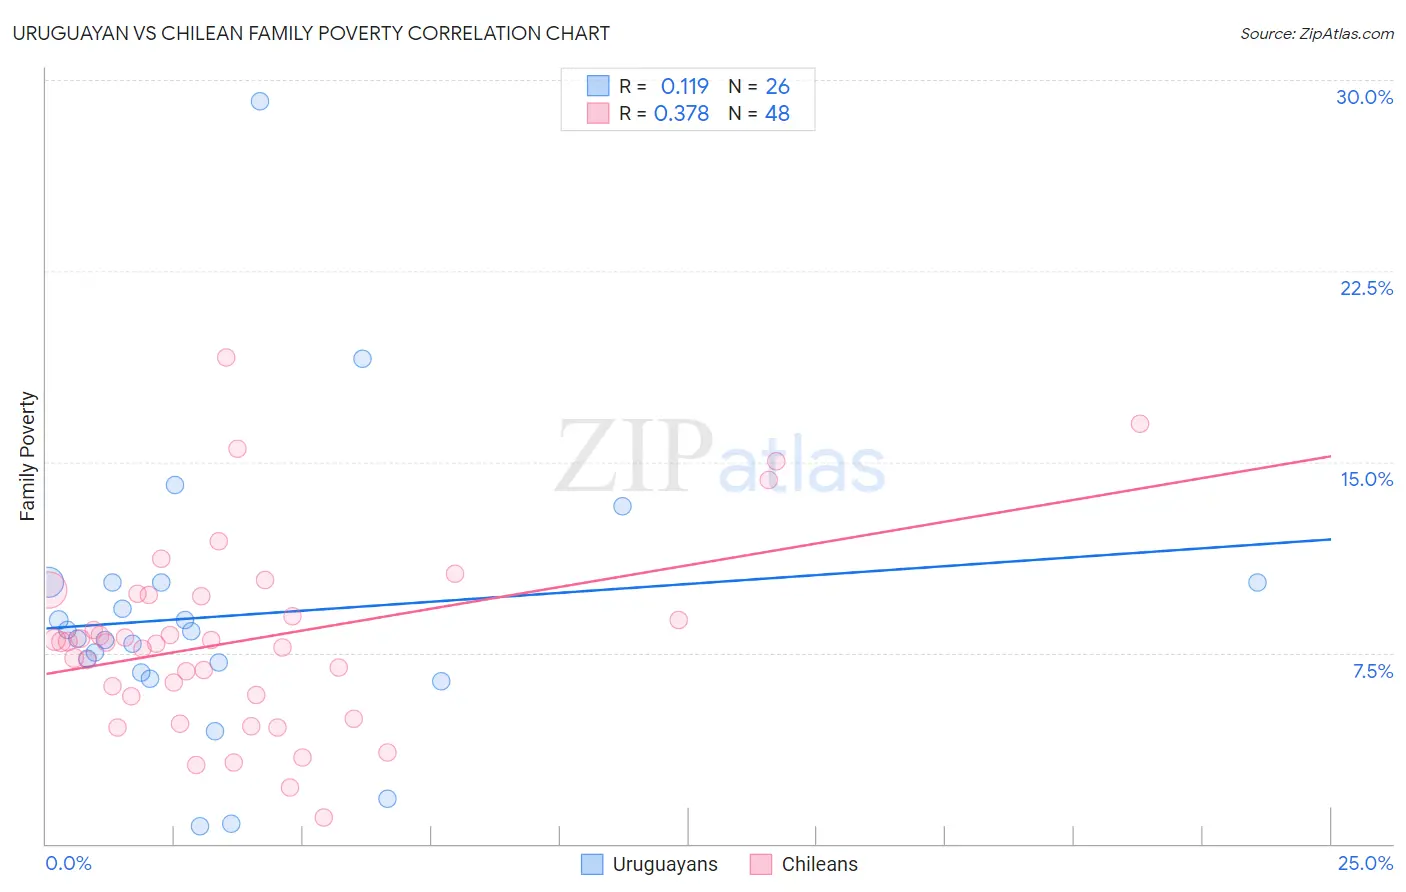
Uruguayan vs Chilean Family Poverty Correlation Chart
The statistical analysis conducted on geographies consisting of 144,644,922 people shows a poor positive correlation between the proportion of Uruguayans and poverty level among families in the United States with a correlation coefficient (R) of 0.119 and weighted average of 9.1%. Similarly, the statistical analysis conducted on geographies consisting of 256,264,406 people shows a mild positive correlation between the proportion of Chileans and poverty level among families in the United States with a correlation coefficient (R) of 0.378 and weighted average of 8.5%, a difference of 8.0%.
Family Poverty Correlation Summary
| Measurement | Uruguayan | Chilean |
| Minimum | 0.67% | 1.0% |
| Maximum | 29.2% | 19.1% |
| Range | 28.5% | 18.1% |
| Mean | 9.0% | 8.0% |
| Median | 8.2% | 7.9% |
| Interquartile 25% (IQ1) | 6.7% | 5.8% |
| Interquartile 75% (IQ3) | 10.2% | 9.7% |
| Interquartile Range (IQR) | 3.5% | 3.9% |
| Standard Deviation (Sample) | 5.7% | 3.7% |
| Standard Deviation (Population) | 5.5% | 3.6% |
Similar Demographics by Family Poverty
Demographics Similar to Uruguayans by Family Poverty
In terms of family poverty, the demographic groups most similar to Uruguayans are South American Indian (9.1%, a difference of 0.070%), Immigrants from Saudi Arabia (9.1%, a difference of 0.080%), Immigrants from Morocco (9.1%, a difference of 0.13%), Hmong (9.1%, a difference of 0.14%), and Colombian (9.2%, a difference of 0.43%).
| Demographics | Rating | Rank | Family Poverty |
| Immigrants | Syria | 47.5 /100 | #176 | Average 9.0% |
| Hawaiians | 47.2 /100 | #177 | Average 9.0% |
| Immigrants | Cameroon | 47.1 /100 | #178 | Average 9.0% |
| Immigrants | Iraq | 44.4 /100 | #179 | Average 9.1% |
| Immigrants | Uganda | 43.4 /100 | #180 | Average 9.1% |
| Hmong | 40.2 /100 | #181 | Average 9.1% |
| Immigrants | Morocco | 40.2 /100 | #182 | Average 9.1% |
| Uruguayans | 39.2 /100 | #183 | Fair 9.1% |
| South American Indians | 38.7 /100 | #184 | Fair 9.1% |
| Immigrants | Saudi Arabia | 38.6 /100 | #185 | Fair 9.1% |
| Colombians | 36.1 /100 | #186 | Fair 9.2% |
| Delaware | 35.4 /100 | #187 | Fair 9.2% |
| Immigrants | Kenya | 34.0 /100 | #188 | Fair 9.2% |
| Immigrants | Afghanistan | 32.1 /100 | #189 | Fair 9.2% |
| Arabs | 31.5 /100 | #190 | Fair 9.2% |
Demographics Similar to Chileans by Family Poverty
In terms of family poverty, the demographic groups most similar to Chileans are Sri Lankan (8.5%, a difference of 0.010%), Immigrants from Malaysia (8.5%, a difference of 0.040%), Immigrants from Brazil (8.5%, a difference of 0.080%), Immigrants from Southern Europe (8.5%, a difference of 0.16%), and Immigrants from Argentina (8.4%, a difference of 0.51%).
| Demographics | Rating | Rank | Family Poverty |
| Immigrants | Hungary | 89.9 /100 | #127 | Excellent 8.4% |
| Argentineans | 89.6 /100 | #128 | Excellent 8.4% |
| Portuguese | 89.2 /100 | #129 | Excellent 8.4% |
| Immigrants | Bosnia and Herzegovina | 88.6 /100 | #130 | Excellent 8.4% |
| Puget Sound Salish | 88.6 /100 | #131 | Excellent 8.4% |
| Immigrants | Argentina | 88.2 /100 | #132 | Excellent 8.4% |
| Sri Lankans | 86.6 /100 | #133 | Excellent 8.5% |
| Chileans | 86.6 /100 | #134 | Excellent 8.5% |
| Immigrants | Malaysia | 86.5 /100 | #135 | Excellent 8.5% |
| Immigrants | Brazil | 86.3 /100 | #136 | Excellent 8.5% |
| Immigrants | Southern Europe | 86.0 /100 | #137 | Excellent 8.5% |
| Armenians | 84.6 /100 | #138 | Excellent 8.5% |
| Immigrants | Nepal | 84.2 /100 | #139 | Excellent 8.5% |
| Immigrants | Kazakhstan | 84.1 /100 | #140 | Excellent 8.5% |
| Immigrants | Ukraine | 83.9 /100 | #141 | Excellent 8.5% |