Immigrants from Somalia vs Chilean Family Poverty
COMPARE
Immigrants from Somalia
Chilean
Family Poverty
Family Poverty Comparison
Immigrants from Somalia
Chileans
11.5%
FAMILY POVERTY
0.0/ 100
METRIC RATING
292nd/ 347
METRIC RANK
8.5%
FAMILY POVERTY
86.6/ 100
METRIC RATING
134th/ 347
METRIC RANK
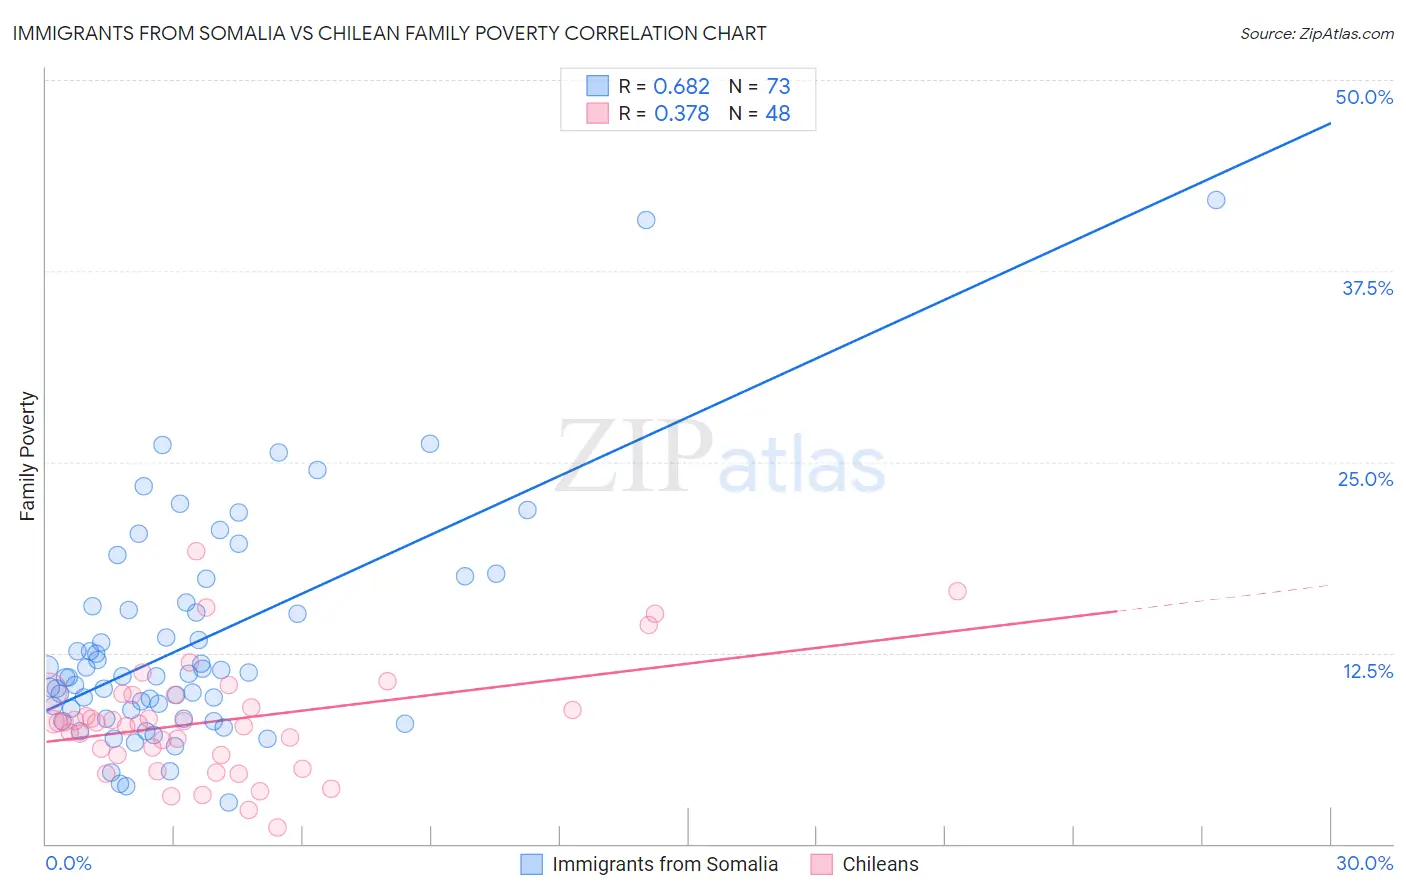
Immigrants from Somalia vs Chilean Family Poverty Correlation Chart
The statistical analysis conducted on geographies consisting of 92,063,103 people shows a significant positive correlation between the proportion of Immigrants from Somalia and poverty level among families in the United States with a correlation coefficient (R) of 0.682 and weighted average of 11.5%. Similarly, the statistical analysis conducted on geographies consisting of 256,264,406 people shows a mild positive correlation between the proportion of Chileans and poverty level among families in the United States with a correlation coefficient (R) of 0.378 and weighted average of 8.5%, a difference of 36.5%.
Family Poverty Correlation Summary
| Measurement | Immigrants from Somalia | Chilean |
| Minimum | 2.7% | 1.0% |
| Maximum | 42.2% | 19.1% |
| Range | 39.5% | 18.1% |
| Mean | 13.1% | 8.0% |
| Median | 11.0% | 7.9% |
| Interquartile 25% (IQ1) | 8.5% | 5.8% |
| Interquartile 75% (IQ3) | 15.7% | 9.7% |
| Interquartile Range (IQR) | 7.2% | 3.9% |
| Standard Deviation (Sample) | 7.4% | 3.7% |
| Standard Deviation (Population) | 7.3% | 3.6% |
Similar Demographics by Family Poverty
Demographics Similar to Immigrants from Somalia by Family Poverty
In terms of family poverty, the demographic groups most similar to Immigrants from Somalia are Haitian (11.5%, a difference of 0.11%), West Indian (11.5%, a difference of 0.17%), Immigrants from Barbados (11.5%, a difference of 0.18%), Immigrants from Belize (11.5%, a difference of 0.22%), and Vietnamese (11.5%, a difference of 0.42%).
| Demographics | Rating | Rank | Family Poverty |
| Barbadians | 0.0 /100 | #285 | Tragic 11.3% |
| Senegalese | 0.0 /100 | #286 | Tragic 11.5% |
| Vietnamese | 0.0 /100 | #287 | Tragic 11.5% |
| Immigrants | Belize | 0.0 /100 | #288 | Tragic 11.5% |
| Immigrants | Barbados | 0.0 /100 | #289 | Tragic 11.5% |
| West Indians | 0.0 /100 | #290 | Tragic 11.5% |
| Haitians | 0.0 /100 | #291 | Tragic 11.5% |
| Immigrants | Somalia | 0.0 /100 | #292 | Tragic 11.5% |
| Immigrants | Cabo Verde | 0.0 /100 | #293 | Tragic 11.6% |
| Immigrants | St. Vincent and the Grenadines | 0.0 /100 | #294 | Tragic 11.6% |
| Immigrants | Haiti | 0.0 /100 | #295 | Tragic 11.6% |
| Choctaw | 0.0 /100 | #296 | Tragic 11.6% |
| Creek | 0.0 /100 | #297 | Tragic 11.7% |
| Immigrants | Senegal | 0.0 /100 | #298 | Tragic 11.7% |
| Dutch West Indians | 0.0 /100 | #299 | Tragic 11.7% |
Demographics Similar to Chileans by Family Poverty
In terms of family poverty, the demographic groups most similar to Chileans are Sri Lankan (8.5%, a difference of 0.010%), Immigrants from Malaysia (8.5%, a difference of 0.040%), Immigrants from Brazil (8.5%, a difference of 0.080%), Immigrants from Southern Europe (8.5%, a difference of 0.16%), and Immigrants from Argentina (8.4%, a difference of 0.51%).
| Demographics | Rating | Rank | Family Poverty |
| Immigrants | Hungary | 89.9 /100 | #127 | Excellent 8.4% |
| Argentineans | 89.6 /100 | #128 | Excellent 8.4% |
| Portuguese | 89.2 /100 | #129 | Excellent 8.4% |
| Immigrants | Bosnia and Herzegovina | 88.6 /100 | #130 | Excellent 8.4% |
| Puget Sound Salish | 88.6 /100 | #131 | Excellent 8.4% |
| Immigrants | Argentina | 88.2 /100 | #132 | Excellent 8.4% |
| Sri Lankans | 86.6 /100 | #133 | Excellent 8.5% |
| Chileans | 86.6 /100 | #134 | Excellent 8.5% |
| Immigrants | Malaysia | 86.5 /100 | #135 | Excellent 8.5% |
| Immigrants | Brazil | 86.3 /100 | #136 | Excellent 8.5% |
| Immigrants | Southern Europe | 86.0 /100 | #137 | Excellent 8.5% |
| Armenians | 84.6 /100 | #138 | Excellent 8.5% |
| Immigrants | Nepal | 84.2 /100 | #139 | Excellent 8.5% |
| Immigrants | Kazakhstan | 84.1 /100 | #140 | Excellent 8.5% |
| Immigrants | Ukraine | 83.9 /100 | #141 | Excellent 8.5% |