Crow vs Immigrants from Sudan Female Poverty
COMPARE
Crow
Immigrants from Sudan
Female Poverty
Female Poverty Comparison
Crow
Immigrants from Sudan
22.1%
FEMALE POVERTY
0.0/ 100
METRIC RATING
341st/ 347
METRIC RANK
15.2%
FEMALE POVERTY
0.4/ 100
METRIC RATING
241st/ 347
METRIC RANK
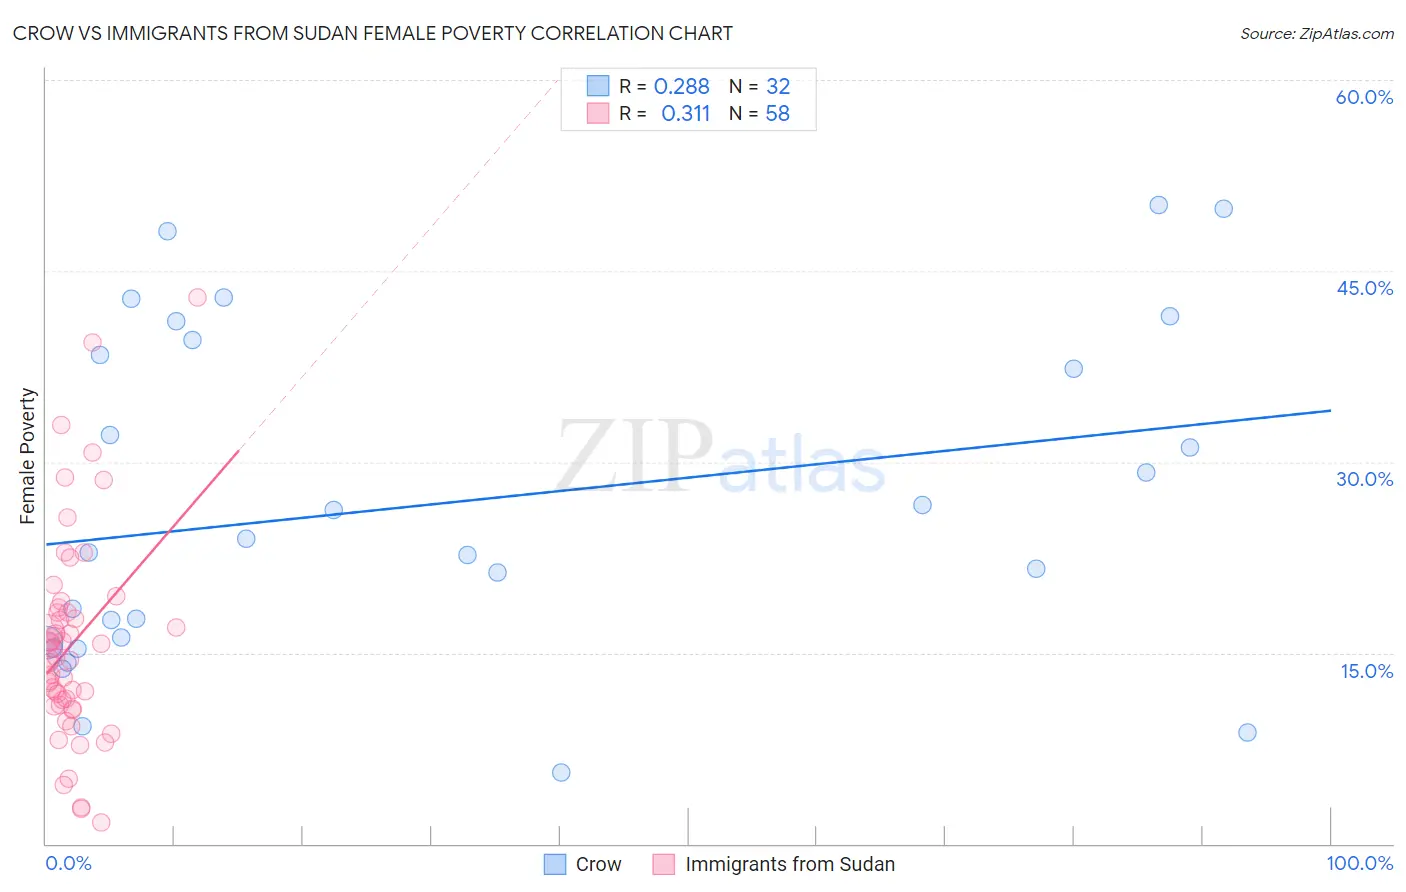
Crow vs Immigrants from Sudan Female Poverty Correlation Chart
The statistical analysis conducted on geographies consisting of 59,198,506 people shows a weak positive correlation between the proportion of Crow and poverty level among females in the United States with a correlation coefficient (R) of 0.288 and weighted average of 22.1%. Similarly, the statistical analysis conducted on geographies consisting of 118,954,745 people shows a mild positive correlation between the proportion of Immigrants from Sudan and poverty level among females in the United States with a correlation coefficient (R) of 0.311 and weighted average of 15.2%, a difference of 45.5%.
Female Poverty Correlation Summary
| Measurement | Crow | Immigrants from Sudan |
| Minimum | 5.6% | 1.7% |
| Maximum | 50.2% | 43.0% |
| Range | 44.6% | 41.3% |
| Mean | 26.8% | 15.7% |
| Median | 23.4% | 14.5% |
| Interquartile 25% (IQ1) | 16.0% | 10.9% |
| Interquartile 75% (IQ3) | 39.0% | 18.2% |
| Interquartile Range (IQR) | 23.0% | 7.3% |
| Standard Deviation (Sample) | 12.9% | 8.2% |
| Standard Deviation (Population) | 12.7% | 8.1% |
Similar Demographics by Female Poverty
Demographics Similar to Crow by Female Poverty
In terms of female poverty, the demographic groups most similar to Crow are Yup'ik (21.5%, a difference of 3.0%), Immigrants from Yemen (22.8%, a difference of 3.2%), Hopi (21.0%, a difference of 5.6%), Sioux (20.9%, a difference of 6.0%), and Lumbee (23.5%, a difference of 6.2%).
| Demographics | Rating | Rank | Female Poverty |
| Immigrants | Dominican Republic | 0.0 /100 | #333 | Tragic 19.3% |
| Houma | 0.0 /100 | #334 | Tragic 20.0% |
| Cheyenne | 0.0 /100 | #335 | Tragic 20.2% |
| Pueblo | 0.0 /100 | #336 | Tragic 20.7% |
| Yuman | 0.0 /100 | #337 | Tragic 20.8% |
| Sioux | 0.0 /100 | #338 | Tragic 20.9% |
| Hopi | 0.0 /100 | #339 | Tragic 21.0% |
| Yup'ik | 0.0 /100 | #340 | Tragic 21.5% |
| Crow | 0.0 /100 | #341 | Tragic 22.1% |
| Immigrants | Yemen | 0.0 /100 | #342 | Tragic 22.8% |
| Lumbee | 0.0 /100 | #343 | Tragic 23.5% |
| Pima | 0.0 /100 | #344 | Tragic 23.6% |
| Navajo | 0.0 /100 | #345 | Tragic 23.9% |
| Puerto Ricans | 0.0 /100 | #346 | Tragic 25.2% |
| Tohono O'odham | 0.0 /100 | #347 | Tragic 25.9% |
Demographics Similar to Immigrants from Sudan by Female Poverty
In terms of female poverty, the demographic groups most similar to Immigrants from Sudan are Nepalese (15.2%, a difference of 0.12%), Sudanese (15.2%, a difference of 0.25%), Immigrants from Middle Africa (15.2%, a difference of 0.30%), Nicaraguan (15.3%, a difference of 0.36%), and Ecuadorian (15.3%, a difference of 0.41%).
| Demographics | Rating | Rank | Female Poverty |
| Fijians | 1.1 /100 | #234 | Tragic 14.9% |
| Immigrants | Laos | 0.9 /100 | #235 | Tragic 15.0% |
| Cree | 0.7 /100 | #236 | Tragic 15.1% |
| French American Indians | 0.6 /100 | #237 | Tragic 15.1% |
| Immigrants | Armenia | 0.6 /100 | #238 | Tragic 15.1% |
| Immigrants | Middle Africa | 0.5 /100 | #239 | Tragic 15.2% |
| Sudanese | 0.5 /100 | #240 | Tragic 15.2% |
| Immigrants | Sudan | 0.4 /100 | #241 | Tragic 15.2% |
| Nepalese | 0.4 /100 | #242 | Tragic 15.2% |
| Nicaraguans | 0.3 /100 | #243 | Tragic 15.3% |
| Ecuadorians | 0.3 /100 | #244 | Tragic 15.3% |
| Spanish American Indians | 0.3 /100 | #245 | Tragic 15.3% |
| Cubans | 0.3 /100 | #246 | Tragic 15.3% |
| Potawatomi | 0.3 /100 | #247 | Tragic 15.3% |
| Immigrants | Ghana | 0.3 /100 | #248 | Tragic 15.3% |