Hungarian vs Immigrants from Sudan Female Poverty
COMPARE
Hungarian
Immigrants from Sudan
Female Poverty
Female Poverty Comparison
Hungarians
Immigrants from Sudan
13.2%
FEMALE POVERTY
70.1/ 100
METRIC RATING
155th/ 347
METRIC RANK
15.2%
FEMALE POVERTY
0.4/ 100
METRIC RATING
241st/ 347
METRIC RANK
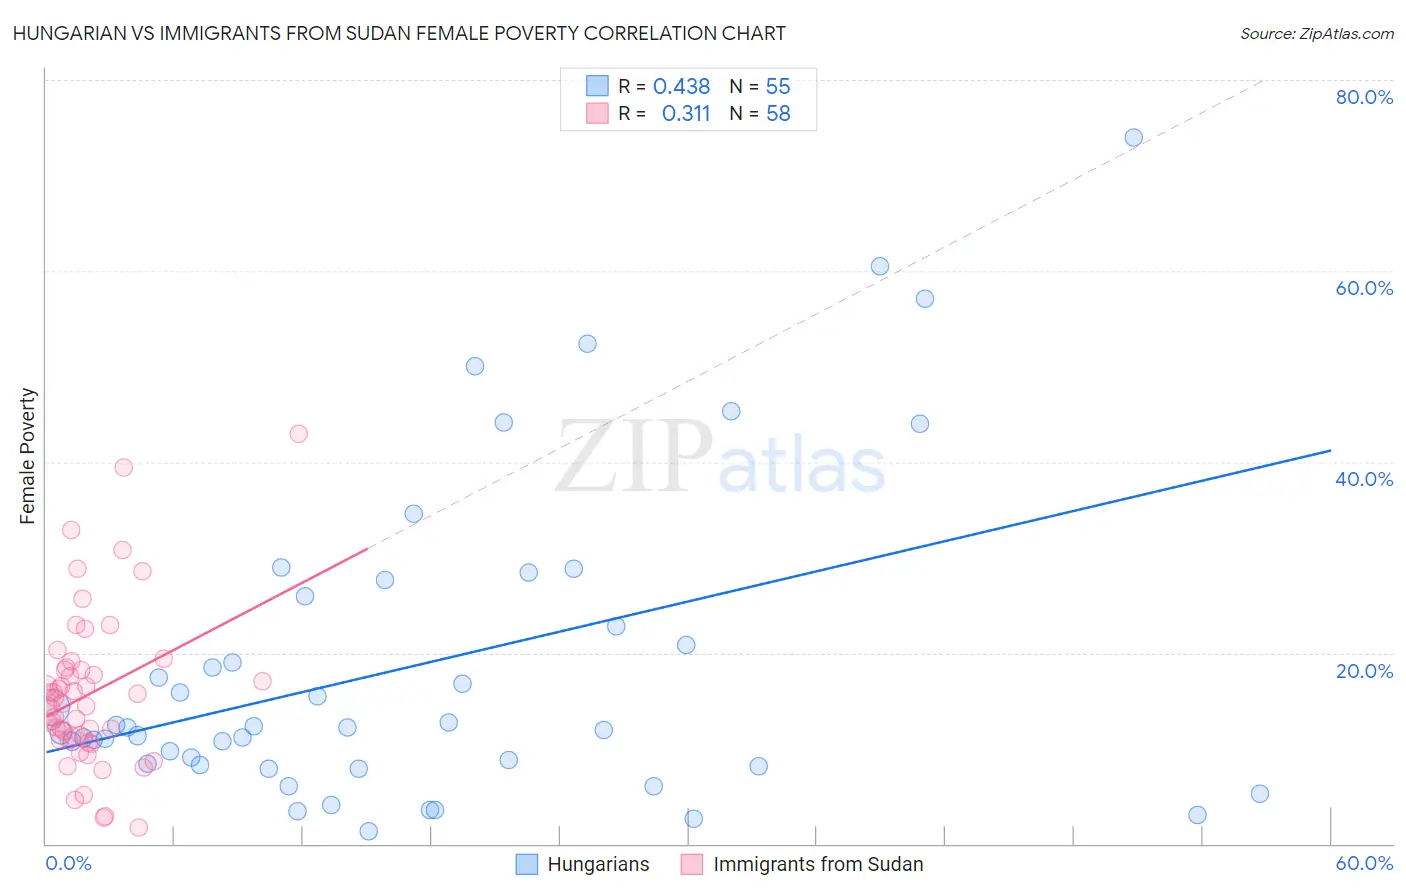
Hungarian vs Immigrants from Sudan Female Poverty Correlation Chart
The statistical analysis conducted on geographies consisting of 485,692,155 people shows a moderate positive correlation between the proportion of Hungarians and poverty level among females in the United States with a correlation coefficient (R) of 0.438 and weighted average of 13.2%. Similarly, the statistical analysis conducted on geographies consisting of 118,954,745 people shows a mild positive correlation between the proportion of Immigrants from Sudan and poverty level among females in the United States with a correlation coefficient (R) of 0.311 and weighted average of 15.2%, a difference of 15.6%.
Female Poverty Correlation Summary
| Measurement | Hungarian | Immigrants from Sudan |
| Minimum | 1.3% | 1.7% |
| Maximum | 73.9% | 43.0% |
| Range | 72.6% | 41.3% |
| Mean | 18.8% | 15.7% |
| Median | 12.1% | 14.5% |
| Interquartile 25% (IQ1) | 8.2% | 10.9% |
| Interquartile 75% (IQ3) | 26.0% | 18.2% |
| Interquartile Range (IQR) | 17.7% | 7.3% |
| Standard Deviation (Sample) | 16.6% | 8.2% |
| Standard Deviation (Population) | 16.5% | 8.1% |
Similar Demographics by Female Poverty
Demographics Similar to Hungarians by Female Poverty
In terms of female poverty, the demographic groups most similar to Hungarians are Armenian (13.2%, a difference of 0.040%), Immigrants from Bosnia and Herzegovina (13.2%, a difference of 0.050%), Immigrants from Fiji (13.2%, a difference of 0.10%), Immigrants from Northern Africa (13.2%, a difference of 0.15%), and Pennsylvania German (13.2%, a difference of 0.32%).
| Demographics | Rating | Rank | Female Poverty |
| Yugoslavians | 76.9 /100 | #148 | Good 13.1% |
| Taiwanese | 75.7 /100 | #149 | Good 13.1% |
| Tsimshian | 75.5 /100 | #150 | Good 13.1% |
| Immigrants | Germany | 74.9 /100 | #151 | Good 13.1% |
| Samoans | 73.6 /100 | #152 | Good 13.1% |
| Immigrants | Fiji | 71.0 /100 | #153 | Good 13.2% |
| Armenians | 70.4 /100 | #154 | Good 13.2% |
| Hungarians | 70.1 /100 | #155 | Good 13.2% |
| Immigrants | Bosnia and Herzegovina | 69.7 /100 | #156 | Good 13.2% |
| Immigrants | Northern Africa | 68.8 /100 | #157 | Good 13.2% |
| Pennsylvania Germans | 67.3 /100 | #158 | Good 13.2% |
| Costa Ricans | 63.6 /100 | #159 | Good 13.3% |
| Immigrants | Nepal | 62.7 /100 | #160 | Good 13.3% |
| Immigrants | Ethiopia | 62.5 /100 | #161 | Good 13.3% |
| Guamanians/Chamorros | 62.4 /100 | #162 | Good 13.3% |
Demographics Similar to Immigrants from Sudan by Female Poverty
In terms of female poverty, the demographic groups most similar to Immigrants from Sudan are Nepalese (15.2%, a difference of 0.12%), Sudanese (15.2%, a difference of 0.25%), Immigrants from Middle Africa (15.2%, a difference of 0.30%), Nicaraguan (15.3%, a difference of 0.36%), and Ecuadorian (15.3%, a difference of 0.41%).
| Demographics | Rating | Rank | Female Poverty |
| Fijians | 1.1 /100 | #234 | Tragic 14.9% |
| Immigrants | Laos | 0.9 /100 | #235 | Tragic 15.0% |
| Cree | 0.7 /100 | #236 | Tragic 15.1% |
| French American Indians | 0.6 /100 | #237 | Tragic 15.1% |
| Immigrants | Armenia | 0.6 /100 | #238 | Tragic 15.1% |
| Immigrants | Middle Africa | 0.5 /100 | #239 | Tragic 15.2% |
| Sudanese | 0.5 /100 | #240 | Tragic 15.2% |
| Immigrants | Sudan | 0.4 /100 | #241 | Tragic 15.2% |
| Nepalese | 0.4 /100 | #242 | Tragic 15.2% |
| Nicaraguans | 0.3 /100 | #243 | Tragic 15.3% |
| Ecuadorians | 0.3 /100 | #244 | Tragic 15.3% |
| Spanish American Indians | 0.3 /100 | #245 | Tragic 15.3% |
| Cubans | 0.3 /100 | #246 | Tragic 15.3% |
| Potawatomi | 0.3 /100 | #247 | Tragic 15.3% |
| Immigrants | Ghana | 0.3 /100 | #248 | Tragic 15.3% |