Immigrants from Eastern Asia vs Immigrants from Sudan Female Poverty
COMPARE
Immigrants from Eastern Asia
Immigrants from Sudan
Female Poverty
Female Poverty Comparison
Immigrants from Eastern Asia
Immigrants from Sudan
12.2%
FEMALE POVERTY
97.8/ 100
METRIC RATING
67th/ 347
METRIC RANK
15.2%
FEMALE POVERTY
0.4/ 100
METRIC RATING
241st/ 347
METRIC RANK
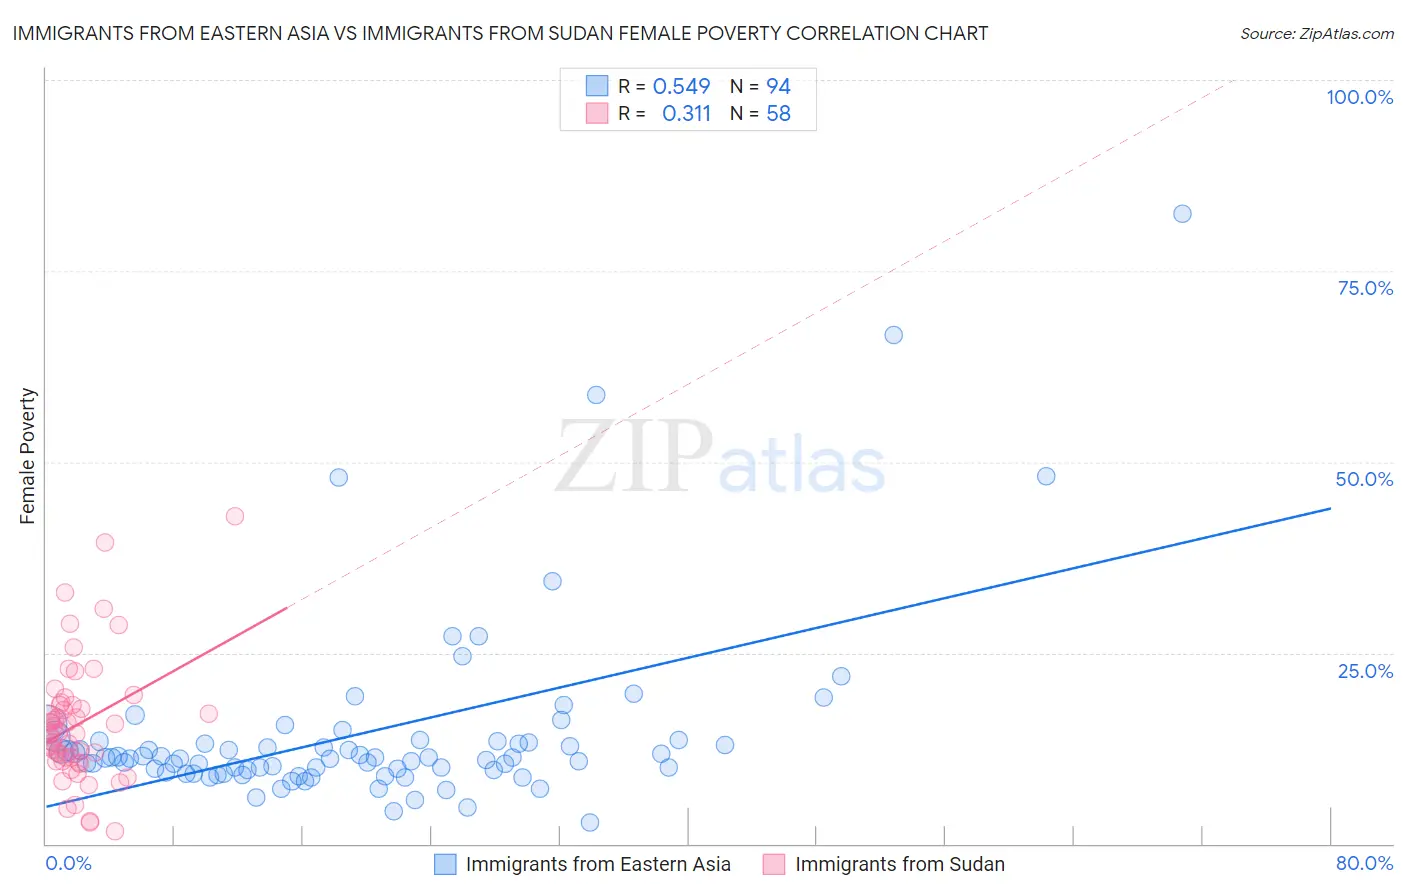
Immigrants from Eastern Asia vs Immigrants from Sudan Female Poverty Correlation Chart
The statistical analysis conducted on geographies consisting of 499,182,216 people shows a substantial positive correlation between the proportion of Immigrants from Eastern Asia and poverty level among females in the United States with a correlation coefficient (R) of 0.549 and weighted average of 12.2%. Similarly, the statistical analysis conducted on geographies consisting of 118,954,745 people shows a mild positive correlation between the proportion of Immigrants from Sudan and poverty level among females in the United States with a correlation coefficient (R) of 0.311 and weighted average of 15.2%, a difference of 24.6%.
Female Poverty Correlation Summary
| Measurement | Immigrants from Eastern Asia | Immigrants from Sudan |
| Minimum | 2.9% | 1.7% |
| Maximum | 82.5% | 43.0% |
| Range | 79.7% | 41.3% |
| Mean | 14.5% | 15.7% |
| Median | 11.3% | 14.5% |
| Interquartile 25% (IQ1) | 9.7% | 10.9% |
| Interquartile 75% (IQ3) | 13.5% | 18.2% |
| Interquartile Range (IQR) | 3.8% | 7.3% |
| Standard Deviation (Sample) | 12.4% | 8.2% |
| Standard Deviation (Population) | 12.3% | 8.1% |
Similar Demographics by Female Poverty
Demographics Similar to Immigrants from Eastern Asia by Female Poverty
In terms of female poverty, the demographic groups most similar to Immigrants from Eastern Asia are Immigrants from Netherlands (12.2%, a difference of 0.040%), Austrian (12.2%, a difference of 0.13%), Indian (Asian) (12.2%, a difference of 0.14%), Swiss (12.2%, a difference of 0.14%), and German (12.2%, a difference of 0.17%).
| Demographics | Rating | Rank | Female Poverty |
| Immigrants | Australia | 98.1 /100 | #60 | Exceptional 12.2% |
| Immigrants | Asia | 98.1 /100 | #61 | Exceptional 12.2% |
| Immigrants | Italy | 98.0 /100 | #62 | Exceptional 12.2% |
| Ukrainians | 98.0 /100 | #63 | Exceptional 12.2% |
| Germans | 98.0 /100 | #64 | Exceptional 12.2% |
| Indians (Asian) | 97.9 /100 | #65 | Exceptional 12.2% |
| Austrians | 97.9 /100 | #66 | Exceptional 12.2% |
| Immigrants | Eastern Asia | 97.8 /100 | #67 | Exceptional 12.2% |
| Immigrants | Netherlands | 97.8 /100 | #68 | Exceptional 12.2% |
| Swiss | 97.7 /100 | #69 | Exceptional 12.2% |
| Immigrants | Belgium | 97.7 /100 | #70 | Exceptional 12.2% |
| Carpatho Rusyns | 97.6 /100 | #71 | Exceptional 12.2% |
| Cambodians | 97.5 /100 | #72 | Exceptional 12.2% |
| Zimbabweans | 97.5 /100 | #73 | Exceptional 12.3% |
| Immigrants | Canada | 97.5 /100 | #74 | Exceptional 12.3% |
Demographics Similar to Immigrants from Sudan by Female Poverty
In terms of female poverty, the demographic groups most similar to Immigrants from Sudan are Nepalese (15.2%, a difference of 0.12%), Sudanese (15.2%, a difference of 0.25%), Immigrants from Middle Africa (15.2%, a difference of 0.30%), Nicaraguan (15.3%, a difference of 0.36%), and Ecuadorian (15.3%, a difference of 0.41%).
| Demographics | Rating | Rank | Female Poverty |
| Fijians | 1.1 /100 | #234 | Tragic 14.9% |
| Immigrants | Laos | 0.9 /100 | #235 | Tragic 15.0% |
| Cree | 0.7 /100 | #236 | Tragic 15.1% |
| French American Indians | 0.6 /100 | #237 | Tragic 15.1% |
| Immigrants | Armenia | 0.6 /100 | #238 | Tragic 15.1% |
| Immigrants | Middle Africa | 0.5 /100 | #239 | Tragic 15.2% |
| Sudanese | 0.5 /100 | #240 | Tragic 15.2% |
| Immigrants | Sudan | 0.4 /100 | #241 | Tragic 15.2% |
| Nepalese | 0.4 /100 | #242 | Tragic 15.2% |
| Nicaraguans | 0.3 /100 | #243 | Tragic 15.3% |
| Ecuadorians | 0.3 /100 | #244 | Tragic 15.3% |
| Spanish American Indians | 0.3 /100 | #245 | Tragic 15.3% |
| Cubans | 0.3 /100 | #246 | Tragic 15.3% |
| Potawatomi | 0.3 /100 | #247 | Tragic 15.3% |
| Immigrants | Ghana | 0.3 /100 | #248 | Tragic 15.3% |