Crow vs Immigrants from Romania Female Poverty
COMPARE
Crow
Immigrants from Romania
Female Poverty
Female Poverty Comparison
Crow
Immigrants from Romania
22.1%
FEMALE POVERTY
0.0/ 100
METRIC RATING
341st/ 347
METRIC RANK
12.0%
FEMALE POVERTY
99.0/ 100
METRIC RATING
49th/ 347
METRIC RANK
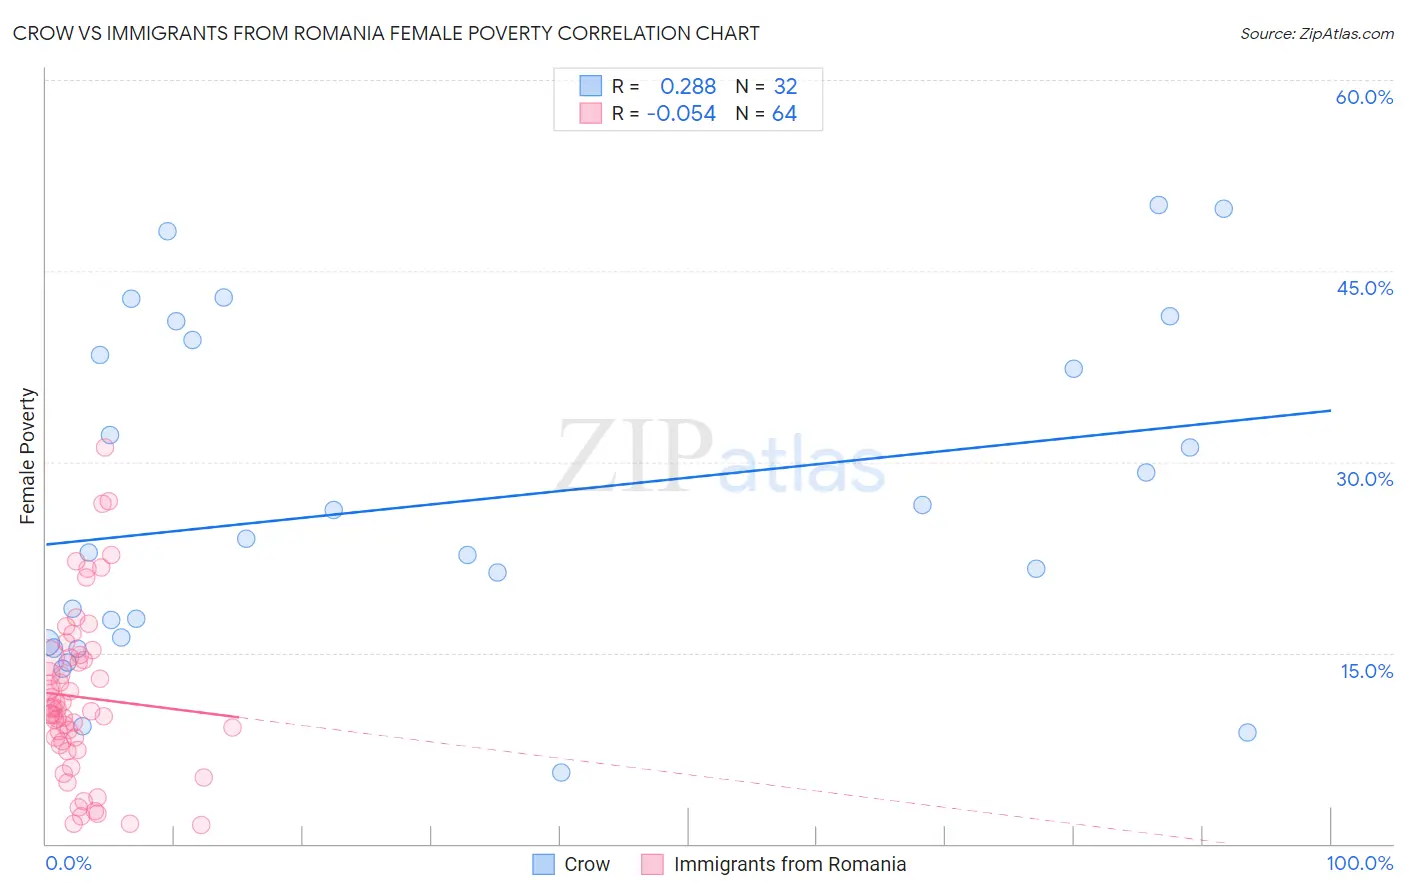
Crow vs Immigrants from Romania Female Poverty Correlation Chart
The statistical analysis conducted on geographies consisting of 59,198,506 people shows a weak positive correlation between the proportion of Crow and poverty level among females in the United States with a correlation coefficient (R) of 0.288 and weighted average of 22.1%. Similarly, the statistical analysis conducted on geographies consisting of 256,918,121 people shows a slight negative correlation between the proportion of Immigrants from Romania and poverty level among females in the United States with a correlation coefficient (R) of -0.054 and weighted average of 12.0%, a difference of 84.9%.
Female Poverty Correlation Summary
| Measurement | Crow | Immigrants from Romania |
| Minimum | 5.6% | 1.5% |
| Maximum | 50.2% | 31.2% |
| Range | 44.6% | 29.7% |
| Mean | 26.8% | 11.5% |
| Median | 23.4% | 10.5% |
| Interquartile 25% (IQ1) | 16.0% | 7.9% |
| Interquartile 75% (IQ3) | 39.0% | 14.6% |
| Interquartile Range (IQR) | 23.0% | 6.7% |
| Standard Deviation (Sample) | 12.9% | 6.5% |
| Standard Deviation (Population) | 12.7% | 6.4% |
Similar Demographics by Female Poverty
Demographics Similar to Crow by Female Poverty
In terms of female poverty, the demographic groups most similar to Crow are Yup'ik (21.5%, a difference of 3.0%), Immigrants from Yemen (22.8%, a difference of 3.2%), Hopi (21.0%, a difference of 5.6%), Sioux (20.9%, a difference of 6.0%), and Lumbee (23.5%, a difference of 6.2%).
| Demographics | Rating | Rank | Female Poverty |
| Immigrants | Dominican Republic | 0.0 /100 | #333 | Tragic 19.3% |
| Houma | 0.0 /100 | #334 | Tragic 20.0% |
| Cheyenne | 0.0 /100 | #335 | Tragic 20.2% |
| Pueblo | 0.0 /100 | #336 | Tragic 20.7% |
| Yuman | 0.0 /100 | #337 | Tragic 20.8% |
| Sioux | 0.0 /100 | #338 | Tragic 20.9% |
| Hopi | 0.0 /100 | #339 | Tragic 21.0% |
| Yup'ik | 0.0 /100 | #340 | Tragic 21.5% |
| Crow | 0.0 /100 | #341 | Tragic 22.1% |
| Immigrants | Yemen | 0.0 /100 | #342 | Tragic 22.8% |
| Lumbee | 0.0 /100 | #343 | Tragic 23.5% |
| Pima | 0.0 /100 | #344 | Tragic 23.6% |
| Navajo | 0.0 /100 | #345 | Tragic 23.9% |
| Puerto Ricans | 0.0 /100 | #346 | Tragic 25.2% |
| Tohono O'odham | 0.0 /100 | #347 | Tragic 25.9% |
Demographics Similar to Immigrants from Romania by Female Poverty
In terms of female poverty, the demographic groups most similar to Immigrants from Romania are Slovene (12.0%, a difference of 0.010%), Immigrants from Japan (11.9%, a difference of 0.19%), Immigrants from Bulgaria (12.0%, a difference of 0.23%), Asian (11.9%, a difference of 0.42%), and Immigrants from Croatia (12.0%, a difference of 0.54%).
| Demographics | Rating | Rank | Female Poverty |
| Immigrants | Moldova | 99.2 /100 | #42 | Exceptional 11.9% |
| Koreans | 99.2 /100 | #43 | Exceptional 11.9% |
| Tongans | 99.2 /100 | #44 | Exceptional 11.9% |
| Immigrants | Czechoslovakia | 99.2 /100 | #45 | Exceptional 11.9% |
| Turks | 99.2 /100 | #46 | Exceptional 11.9% |
| Asians | 99.1 /100 | #47 | Exceptional 11.9% |
| Immigrants | Japan | 99.0 /100 | #48 | Exceptional 11.9% |
| Immigrants | Romania | 99.0 /100 | #49 | Exceptional 12.0% |
| Slovenes | 98.9 /100 | #50 | Exceptional 12.0% |
| Immigrants | Bulgaria | 98.9 /100 | #51 | Exceptional 12.0% |
| Immigrants | Croatia | 98.7 /100 | #52 | Exceptional 12.0% |
| Immigrants | Austria | 98.7 /100 | #53 | Exceptional 12.0% |
| Immigrants | Philippines | 98.7 /100 | #54 | Exceptional 12.1% |
| Immigrants | Sri Lanka | 98.5 /100 | #55 | Exceptional 12.1% |
| Estonians | 98.3 /100 | #56 | Exceptional 12.1% |