Bermudan vs Immigrants from Sudan Female Poverty
COMPARE
Bermudan
Immigrants from Sudan
Female Poverty
Female Poverty Comparison
Bermudans
Immigrants from Sudan
14.4%
FEMALE POVERTY
5.5/ 100
METRIC RATING
212th/ 347
METRIC RANK
15.2%
FEMALE POVERTY
0.4/ 100
METRIC RATING
241st/ 347
METRIC RANK
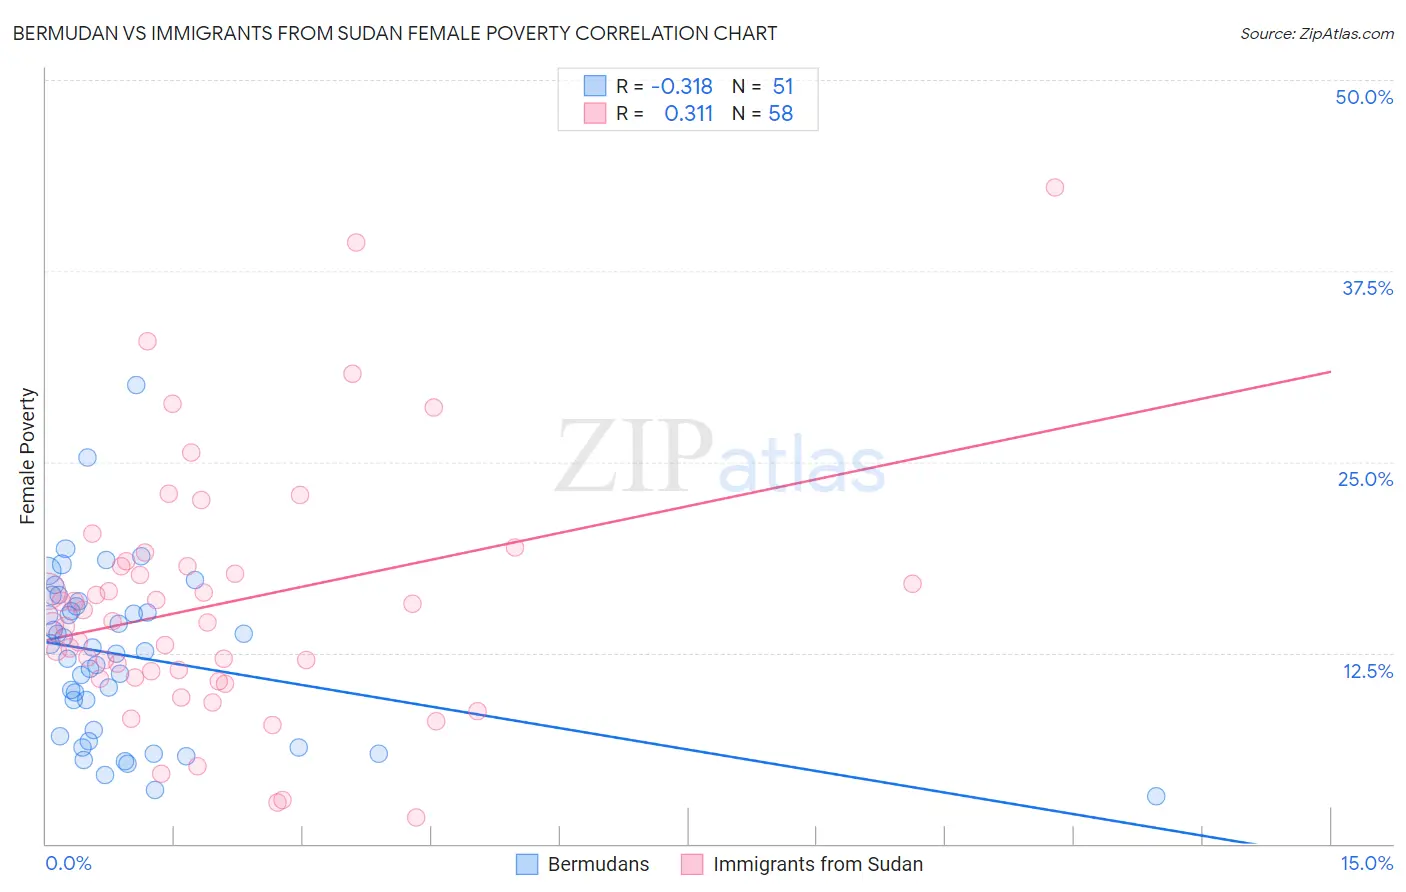
Bermudan vs Immigrants from Sudan Female Poverty Correlation Chart
The statistical analysis conducted on geographies consisting of 55,716,155 people shows a mild negative correlation between the proportion of Bermudans and poverty level among females in the United States with a correlation coefficient (R) of -0.318 and weighted average of 14.4%. Similarly, the statistical analysis conducted on geographies consisting of 118,954,745 people shows a mild positive correlation between the proportion of Immigrants from Sudan and poverty level among females in the United States with a correlation coefficient (R) of 0.311 and weighted average of 15.2%, a difference of 6.0%.
Female Poverty Correlation Summary
| Measurement | Bermudan | Immigrants from Sudan |
| Minimum | 3.1% | 1.7% |
| Maximum | 30.0% | 43.0% |
| Range | 26.9% | 41.3% |
| Mean | 12.3% | 15.7% |
| Median | 12.6% | 14.5% |
| Interquartile 25% (IQ1) | 7.0% | 10.9% |
| Interquartile 75% (IQ3) | 15.6% | 18.2% |
| Interquartile Range (IQR) | 8.5% | 7.3% |
| Standard Deviation (Sample) | 5.5% | 8.2% |
| Standard Deviation (Population) | 5.5% | 8.1% |
Similar Demographics by Female Poverty
Demographics Similar to Bermudans by Female Poverty
In terms of female poverty, the demographic groups most similar to Bermudans are Alaskan Athabascan (14.4%, a difference of 0.080%), Marshallese (14.4%, a difference of 0.24%), Immigrants from Panama (14.4%, a difference of 0.39%), Immigrants from Thailand (14.4%, a difference of 0.47%), and Immigrants (14.4%, a difference of 0.51%).
| Demographics | Rating | Rank | Female Poverty |
| Ugandans | 15.4 /100 | #205 | Poor 14.0% |
| Immigrants | Uruguay | 14.0 /100 | #206 | Poor 14.0% |
| Immigrants | Eastern Africa | 9.0 /100 | #207 | Tragic 14.2% |
| Immigrants | Azores | 7.9 /100 | #208 | Tragic 14.2% |
| Panamanians | 7.7 /100 | #209 | Tragic 14.2% |
| Malaysians | 7.4 /100 | #210 | Tragic 14.3% |
| Moroccans | 7.2 /100 | #211 | Tragic 14.3% |
| Bermudans | 5.5 /100 | #212 | Tragic 14.4% |
| Alaskan Athabascans | 5.3 /100 | #213 | Tragic 14.4% |
| Marshallese | 5.0 /100 | #214 | Tragic 14.4% |
| Immigrants | Panama | 4.7 /100 | #215 | Tragic 14.4% |
| Immigrants | Thailand | 4.5 /100 | #216 | Tragic 14.4% |
| Immigrants | Immigrants | 4.5 /100 | #217 | Tragic 14.4% |
| Immigrants | Uzbekistan | 4.4 /100 | #218 | Tragic 14.4% |
| Japanese | 4.1 /100 | #219 | Tragic 14.5% |
Demographics Similar to Immigrants from Sudan by Female Poverty
In terms of female poverty, the demographic groups most similar to Immigrants from Sudan are Nepalese (15.2%, a difference of 0.12%), Sudanese (15.2%, a difference of 0.25%), Immigrants from Middle Africa (15.2%, a difference of 0.30%), Nicaraguan (15.3%, a difference of 0.36%), and Ecuadorian (15.3%, a difference of 0.41%).
| Demographics | Rating | Rank | Female Poverty |
| Fijians | 1.1 /100 | #234 | Tragic 14.9% |
| Immigrants | Laos | 0.9 /100 | #235 | Tragic 15.0% |
| Cree | 0.7 /100 | #236 | Tragic 15.1% |
| French American Indians | 0.6 /100 | #237 | Tragic 15.1% |
| Immigrants | Armenia | 0.6 /100 | #238 | Tragic 15.1% |
| Immigrants | Middle Africa | 0.5 /100 | #239 | Tragic 15.2% |
| Sudanese | 0.5 /100 | #240 | Tragic 15.2% |
| Immigrants | Sudan | 0.4 /100 | #241 | Tragic 15.2% |
| Nepalese | 0.4 /100 | #242 | Tragic 15.2% |
| Nicaraguans | 0.3 /100 | #243 | Tragic 15.3% |
| Ecuadorians | 0.3 /100 | #244 | Tragic 15.3% |
| Spanish American Indians | 0.3 /100 | #245 | Tragic 15.3% |
| Cubans | 0.3 /100 | #246 | Tragic 15.3% |
| Potawatomi | 0.3 /100 | #247 | Tragic 15.3% |
| Immigrants | Ghana | 0.3 /100 | #248 | Tragic 15.3% |