Celtic vs Immigrants from Sudan Female Poverty
COMPARE
Celtic
Immigrants from Sudan
Female Poverty
Female Poverty Comparison
Celtics
Immigrants from Sudan
13.4%
FEMALE POVERTY
49.9/ 100
METRIC RATING
175th/ 347
METRIC RANK
15.2%
FEMALE POVERTY
0.4/ 100
METRIC RATING
241st/ 347
METRIC RANK
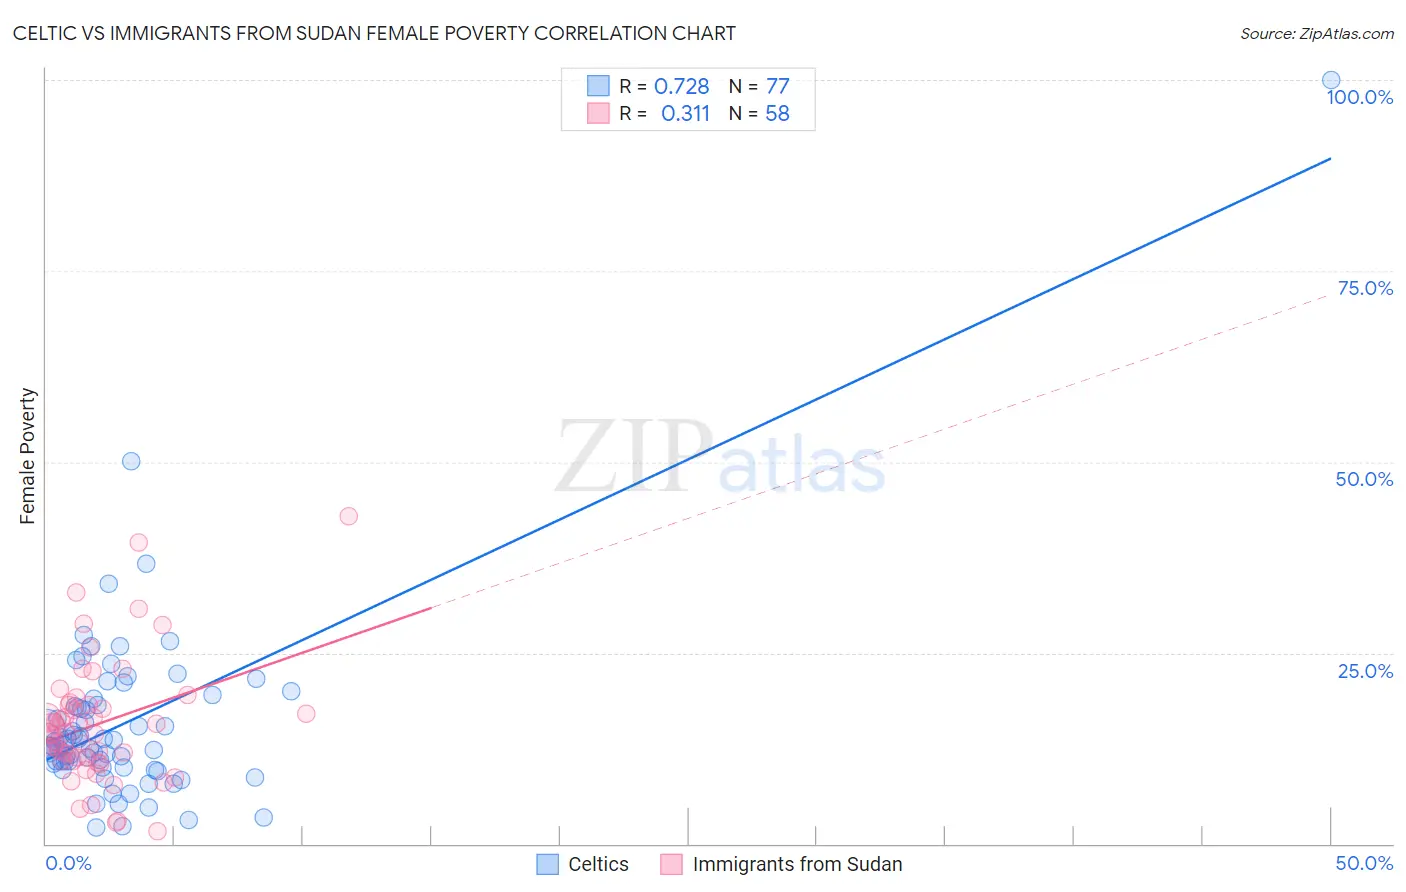
Celtic vs Immigrants from Sudan Female Poverty Correlation Chart
The statistical analysis conducted on geographies consisting of 168,846,795 people shows a strong positive correlation between the proportion of Celtics and poverty level among females in the United States with a correlation coefficient (R) of 0.728 and weighted average of 13.4%. Similarly, the statistical analysis conducted on geographies consisting of 118,954,745 people shows a mild positive correlation between the proportion of Immigrants from Sudan and poverty level among females in the United States with a correlation coefficient (R) of 0.311 and weighted average of 15.2%, a difference of 13.2%.
Female Poverty Correlation Summary
| Measurement | Celtic | Immigrants from Sudan |
| Minimum | 2.2% | 1.7% |
| Maximum | 100.0% | 43.0% |
| Range | 97.8% | 41.3% |
| Mean | 15.9% | 15.7% |
| Median | 12.9% | 14.5% |
| Interquartile 25% (IQ1) | 10.3% | 10.9% |
| Interquartile 75% (IQ3) | 18.6% | 18.2% |
| Interquartile Range (IQR) | 8.3% | 7.3% |
| Standard Deviation (Sample) | 12.5% | 8.2% |
| Standard Deviation (Population) | 12.5% | 8.1% |
Similar Demographics by Female Poverty
Demographics Similar to Celtics by Female Poverty
In terms of female poverty, the demographic groups most similar to Celtics are Immigrants from Spain (13.4%, a difference of 0.0%), Immigrants from Iraq (13.4%, a difference of 0.010%), Immigrants from Morocco (13.4%, a difference of 0.050%), Immigrants from Afghanistan (13.4%, a difference of 0.080%), and Israeli (13.5%, a difference of 0.080%).
| Demographics | Rating | Rank | Female Poverty |
| Aleuts | 56.7 /100 | #168 | Average 13.4% |
| Lebanese | 55.9 /100 | #169 | Average 13.4% |
| Colombians | 55.7 /100 | #170 | Average 13.4% |
| Whites/Caucasians | 54.6 /100 | #171 | Average 13.4% |
| Mongolians | 53.6 /100 | #172 | Average 13.4% |
| Immigrants | Afghanistan | 50.8 /100 | #173 | Average 13.4% |
| Immigrants | Iraq | 50.0 /100 | #174 | Average 13.4% |
| Celtics | 49.9 /100 | #175 | Average 13.4% |
| Immigrants | Spain | 49.9 /100 | #176 | Average 13.4% |
| Immigrants | Morocco | 49.4 /100 | #177 | Average 13.4% |
| Israelis | 49.1 /100 | #178 | Average 13.5% |
| Immigrants | Syria | 48.8 /100 | #179 | Average 13.5% |
| South Americans | 44.8 /100 | #180 | Average 13.5% |
| Venezuelans | 44.5 /100 | #181 | Average 13.5% |
| Immigrants | Colombia | 44.5 /100 | #182 | Average 13.5% |
Demographics Similar to Immigrants from Sudan by Female Poverty
In terms of female poverty, the demographic groups most similar to Immigrants from Sudan are Nepalese (15.2%, a difference of 0.12%), Sudanese (15.2%, a difference of 0.25%), Immigrants from Middle Africa (15.2%, a difference of 0.30%), Nicaraguan (15.3%, a difference of 0.36%), and Ecuadorian (15.3%, a difference of 0.41%).
| Demographics | Rating | Rank | Female Poverty |
| Fijians | 1.1 /100 | #234 | Tragic 14.9% |
| Immigrants | Laos | 0.9 /100 | #235 | Tragic 15.0% |
| Cree | 0.7 /100 | #236 | Tragic 15.1% |
| French American Indians | 0.6 /100 | #237 | Tragic 15.1% |
| Immigrants | Armenia | 0.6 /100 | #238 | Tragic 15.1% |
| Immigrants | Middle Africa | 0.5 /100 | #239 | Tragic 15.2% |
| Sudanese | 0.5 /100 | #240 | Tragic 15.2% |
| Immigrants | Sudan | 0.4 /100 | #241 | Tragic 15.2% |
| Nepalese | 0.4 /100 | #242 | Tragic 15.2% |
| Nicaraguans | 0.3 /100 | #243 | Tragic 15.3% |
| Ecuadorians | 0.3 /100 | #244 | Tragic 15.3% |
| Spanish American Indians | 0.3 /100 | #245 | Tragic 15.3% |
| Cubans | 0.3 /100 | #246 | Tragic 15.3% |
| Potawatomi | 0.3 /100 | #247 | Tragic 15.3% |
| Immigrants | Ghana | 0.3 /100 | #248 | Tragic 15.3% |