Crow vs Immigrants from Sudan Per Capita Income
COMPARE
Crow
Immigrants from Sudan
Per Capita Income
Per Capita Income Comparison
Crow
Immigrants from Sudan
$31,729
PER CAPITA INCOME
0.0/ 100
METRIC RATING
340th/ 347
METRIC RANK
$41,986
PER CAPITA INCOME
13.2/ 100
METRIC RATING
209th/ 347
METRIC RANK
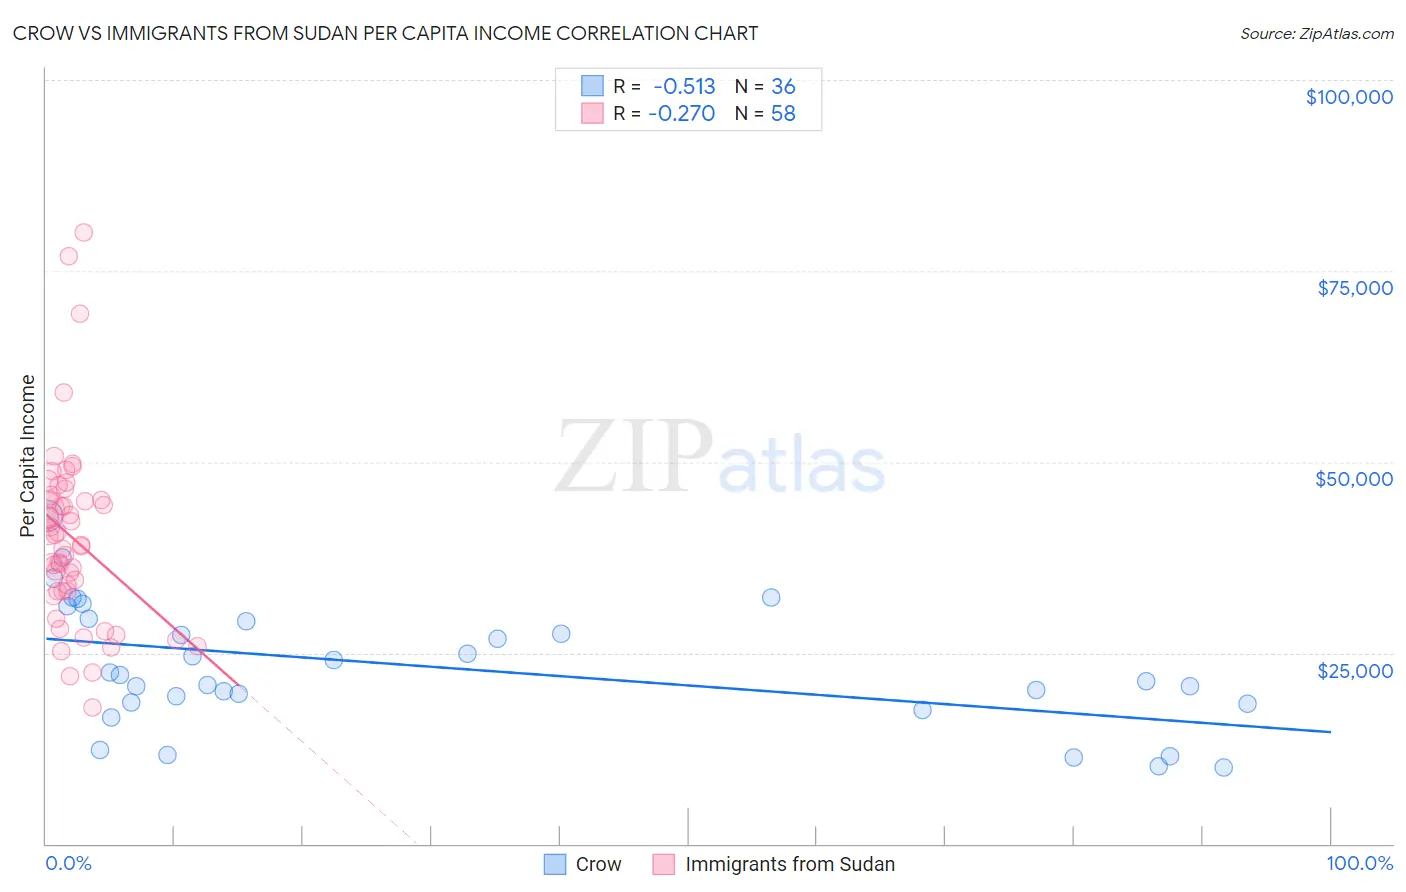
Crow vs Immigrants from Sudan Per Capita Income Correlation Chart
The statistical analysis conducted on geographies consisting of 59,209,980 people shows a substantial negative correlation between the proportion of Crow and per capita income in the United States with a correlation coefficient (R) of -0.513 and weighted average of $31,729. Similarly, the statistical analysis conducted on geographies consisting of 118,972,993 people shows a weak negative correlation between the proportion of Immigrants from Sudan and per capita income in the United States with a correlation coefficient (R) of -0.270 and weighted average of $41,986, a difference of 32.3%.
Per Capita Income Correlation Summary
| Measurement | Crow | Immigrants from Sudan |
| Minimum | $9,914 | $17,842 |
| Maximum | $42,917 | $80,005 |
| Range | $33,003 | $62,163 |
| Mean | $23,129 | $40,107 |
| Median | $21,705 | $39,743 |
| Interquartile 25% (IQ1) | $18,390 | $33,055 |
| Interquartile 75% (IQ3) | $29,346 | $45,054 |
| Interquartile Range (IQR) | $10,956 | $11,999 |
| Standard Deviation (Sample) | $8,112 | $11,901 |
| Standard Deviation (Population) | $7,999 | $11,798 |
Similar Demographics by Per Capita Income
Demographics Similar to Crow by Per Capita Income
In terms of per capita income, the demographic groups most similar to Crow are Pueblo ($32,012, a difference of 0.89%), Puerto Rican ($31,268, a difference of 1.5%), Hopi ($31,177, a difference of 1.8%), Arapaho ($32,345, a difference of 1.9%), and Pima ($30,644, a difference of 3.5%).
| Demographics | Rating | Rank | Per Capita Income |
| Immigrants | Yemen | 0.0 /100 | #333 | Tragic $33,696 |
| Natives/Alaskans | 0.0 /100 | #334 | Tragic $33,279 |
| Yuman | 0.0 /100 | #335 | Tragic $33,236 |
| Yakama | 0.0 /100 | #336 | Tragic $33,009 |
| Houma | 0.0 /100 | #337 | Tragic $32,996 |
| Arapaho | 0.0 /100 | #338 | Tragic $32,345 |
| Pueblo | 0.0 /100 | #339 | Tragic $32,012 |
| Crow | 0.0 /100 | #340 | Tragic $31,729 |
| Puerto Ricans | 0.0 /100 | #341 | Tragic $31,268 |
| Hopi | 0.0 /100 | #342 | Tragic $31,177 |
| Pima | 0.0 /100 | #343 | Tragic $30,644 |
| Yup'ik | 0.0 /100 | #344 | Tragic $30,518 |
| Tohono O'odham | 0.0 /100 | #345 | Tragic $30,256 |
| Lumbee | 0.0 /100 | #346 | Tragic $29,845 |
| Navajo | 0.0 /100 | #347 | Tragic $29,031 |
Demographics Similar to Immigrants from Sudan by Per Capita Income
In terms of per capita income, the demographic groups most similar to Immigrants from Sudan are Ecuadorian ($41,958, a difference of 0.070%), Panamanian ($42,035, a difference of 0.12%), Venezuelan ($42,074, a difference of 0.21%), Immigrants from Panama ($41,853, a difference of 0.32%), and Immigrants from Senegal ($41,830, a difference of 0.37%).
| Demographics | Rating | Rank | Per Capita Income |
| Immigrants | Bosnia and Herzegovina | 17.5 /100 | #202 | Poor $42,278 |
| Spanish | 17.0 /100 | #203 | Poor $42,249 |
| Aleuts | 16.4 /100 | #204 | Poor $42,210 |
| Whites/Caucasians | 15.9 /100 | #205 | Poor $42,180 |
| Ghanaians | 15.7 /100 | #206 | Poor $42,164 |
| Venezuelans | 14.4 /100 | #207 | Poor $42,074 |
| Panamanians | 13.9 /100 | #208 | Poor $42,035 |
| Immigrants | Sudan | 13.2 /100 | #209 | Poor $41,986 |
| Ecuadorians | 12.9 /100 | #210 | Poor $41,958 |
| Immigrants | Panama | 11.6 /100 | #211 | Poor $41,853 |
| Immigrants | Senegal | 11.3 /100 | #212 | Poor $41,830 |
| Immigrants | Venezuela | 10.2 /100 | #213 | Poor $41,727 |
| Immigrants | Bangladesh | 10.1 /100 | #214 | Poor $41,709 |
| Sudanese | 9.9 /100 | #215 | Tragic $41,695 |
| Tongans | 9.9 /100 | #216 | Tragic $41,693 |