Immigrants from Laos vs Immigrants from Sudan Female Poverty
COMPARE
Immigrants from Laos
Immigrants from Sudan
Female Poverty
Female Poverty Comparison
Immigrants from Laos
Immigrants from Sudan
15.0%
FEMALE POVERTY
0.9/ 100
METRIC RATING
235th/ 347
METRIC RANK
15.2%
FEMALE POVERTY
0.4/ 100
METRIC RATING
241st/ 347
METRIC RANK
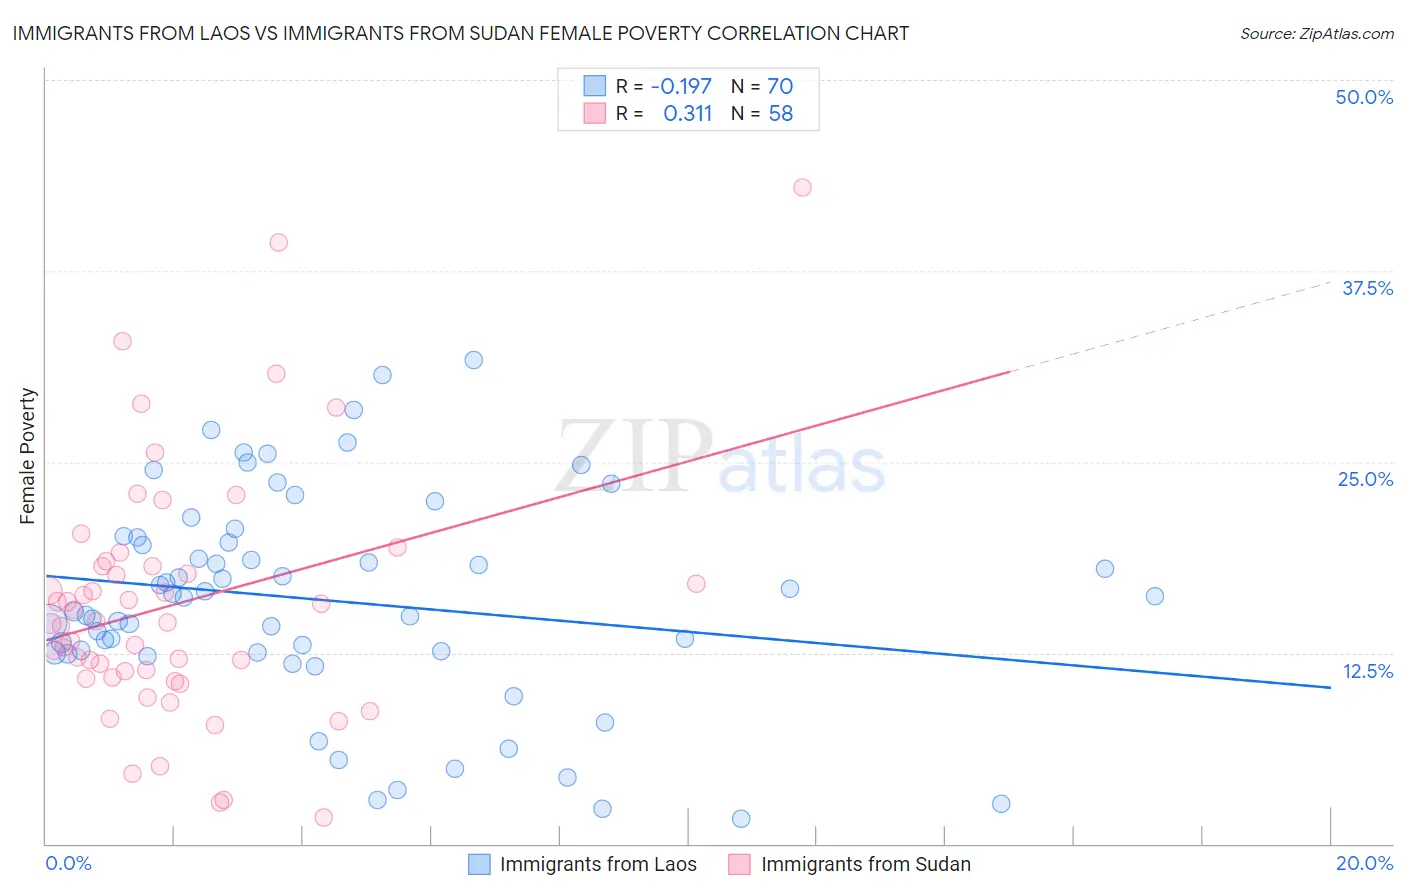
Immigrants from Laos vs Immigrants from Sudan Female Poverty Correlation Chart
The statistical analysis conducted on geographies consisting of 201,464,148 people shows a poor negative correlation between the proportion of Immigrants from Laos and poverty level among females in the United States with a correlation coefficient (R) of -0.197 and weighted average of 15.0%. Similarly, the statistical analysis conducted on geographies consisting of 118,954,745 people shows a mild positive correlation between the proportion of Immigrants from Sudan and poverty level among females in the United States with a correlation coefficient (R) of 0.311 and weighted average of 15.2%, a difference of 1.7%.
Female Poverty Correlation Summary
| Measurement | Immigrants from Laos | Immigrants from Sudan |
| Minimum | 1.6% | 1.7% |
| Maximum | 31.7% | 43.0% |
| Range | 30.1% | 41.3% |
| Mean | 15.9% | 15.7% |
| Median | 16.1% | 14.5% |
| Interquartile 25% (IQ1) | 12.6% | 10.9% |
| Interquartile 75% (IQ3) | 20.1% | 18.2% |
| Interquartile Range (IQR) | 7.5% | 7.3% |
| Standard Deviation (Sample) | 7.0% | 8.2% |
| Standard Deviation (Population) | 6.9% | 8.1% |
Demographics Similar to Immigrants from Laos and Immigrants from Sudan by Female Poverty
In terms of female poverty, the demographic groups most similar to Immigrants from Laos are Fijian (14.9%, a difference of 0.44%), Cree (15.1%, a difference of 0.63%), French American Indian (15.1%, a difference of 0.82%), Immigrants from Armenia (15.1%, a difference of 0.90%), and Immigrants from Saudi Arabia (14.8%, a difference of 0.96%). Similarly, the demographic groups most similar to Immigrants from Sudan are Nepalese (15.2%, a difference of 0.12%), Sudanese (15.2%, a difference of 0.25%), Immigrants from Middle Africa (15.2%, a difference of 0.30%), Nicaraguan (15.3%, a difference of 0.36%), and Ecuadorian (15.3%, a difference of 0.41%).
| Demographics | Rating | Rank | Female Poverty |
| German Russians | 2.0 /100 | #228 | Tragic 14.7% |
| Ghanaians | 1.9 /100 | #229 | Tragic 14.7% |
| Alaska Natives | 1.8 /100 | #230 | Tragic 14.7% |
| Nigerians | 1.7 /100 | #231 | Tragic 14.8% |
| Osage | 1.5 /100 | #232 | Tragic 14.8% |
| Immigrants | Saudi Arabia | 1.4 /100 | #233 | Tragic 14.8% |
| Fijians | 1.1 /100 | #234 | Tragic 14.9% |
| Immigrants | Laos | 0.9 /100 | #235 | Tragic 15.0% |
| Cree | 0.7 /100 | #236 | Tragic 15.1% |
| French American Indians | 0.6 /100 | #237 | Tragic 15.1% |
| Immigrants | Armenia | 0.6 /100 | #238 | Tragic 15.1% |
| Immigrants | Middle Africa | 0.5 /100 | #239 | Tragic 15.2% |
| Sudanese | 0.5 /100 | #240 | Tragic 15.2% |
| Immigrants | Sudan | 0.4 /100 | #241 | Tragic 15.2% |
| Nepalese | 0.4 /100 | #242 | Tragic 15.2% |
| Nicaraguans | 0.3 /100 | #243 | Tragic 15.3% |
| Ecuadorians | 0.3 /100 | #244 | Tragic 15.3% |
| Spanish American Indians | 0.3 /100 | #245 | Tragic 15.3% |
| Cubans | 0.3 /100 | #246 | Tragic 15.3% |
| Potawatomi | 0.3 /100 | #247 | Tragic 15.3% |
| Immigrants | Ghana | 0.3 /100 | #248 | Tragic 15.3% |