Croatian vs Comanche Single Mother Poverty
COMPARE
Croatian
Comanche
Single Mother Poverty
Single Mother Poverty Comparison
Croatians
Comanche
28.2%
SINGLE MOTHER POVERTY
94.8/ 100
METRIC RATING
110th/ 347
METRIC RANK
33.9%
SINGLE MOTHER POVERTY
0.0/ 100
METRIC RATING
307th/ 347
METRIC RANK
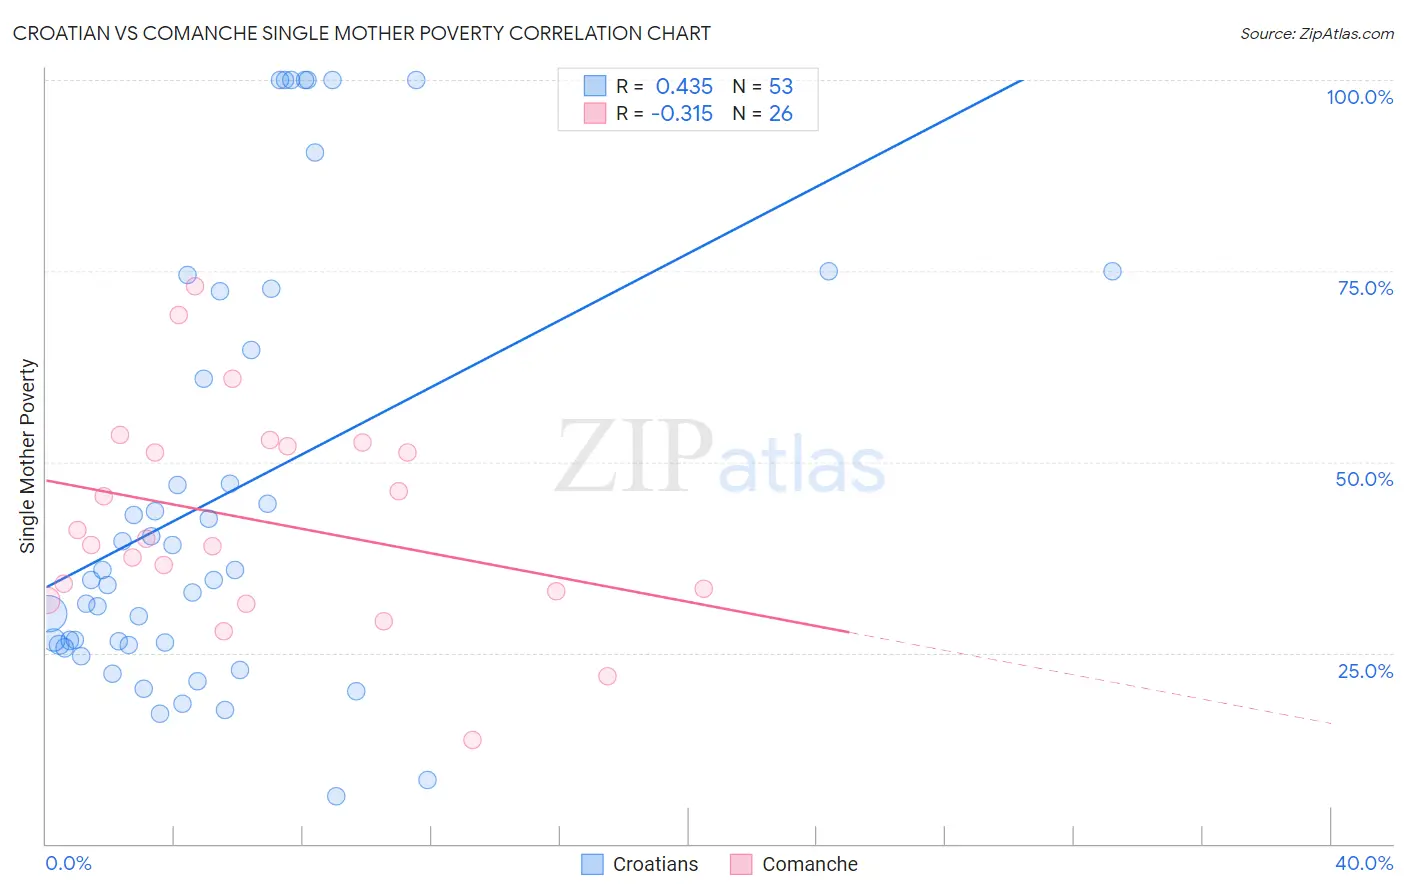
Croatian vs Comanche Single Mother Poverty Correlation Chart
The statistical analysis conducted on geographies consisting of 364,805,698 people shows a moderate positive correlation between the proportion of Croatians and poverty level among single mothers in the United States with a correlation coefficient (R) of 0.435 and weighted average of 28.2%. Similarly, the statistical analysis conducted on geographies consisting of 109,063,480 people shows a mild negative correlation between the proportion of Comanche and poverty level among single mothers in the United States with a correlation coefficient (R) of -0.315 and weighted average of 33.9%, a difference of 20.5%.
Single Mother Poverty Correlation Summary
| Measurement | Croatian | Comanche |
| Minimum | 6.2% | 13.6% |
| Maximum | 100.0% | 73.0% |
| Range | 93.8% | 59.3% |
| Mean | 45.5% | 42.2% |
| Median | 34.6% | 39.6% |
| Interquartile 25% (IQ1) | 26.0% | 33.1% |
| Interquartile 75% (IQ3) | 68.5% | 52.0% |
| Interquartile Range (IQR) | 42.5% | 18.9% |
| Standard Deviation (Sample) | 28.0% | 13.9% |
| Standard Deviation (Population) | 27.7% | 13.6% |
Similar Demographics by Single Mother Poverty
Demographics Similar to Croatians by Single Mother Poverty
In terms of single mother poverty, the demographic groups most similar to Croatians are Venezuelan (28.2%, a difference of 0.050%), Immigrants from Kazakhstan (28.2%, a difference of 0.060%), Immigrants from Armenia (28.1%, a difference of 0.12%), Immigrants from Zimbabwe (28.1%, a difference of 0.21%), and Immigrants from Venezuela (28.1%, a difference of 0.29%).
| Demographics | Rating | Rank | Single Mother Poverty |
| Immigrants | Northern Africa | 96.6 /100 | #103 | Exceptional 28.0% |
| Italians | 96.6 /100 | #104 | Exceptional 28.0% |
| Israelis | 96.5 /100 | #105 | Exceptional 28.0% |
| Ukrainians | 96.4 /100 | #106 | Exceptional 28.0% |
| Immigrants | Venezuela | 95.8 /100 | #107 | Exceptional 28.1% |
| Immigrants | Zimbabwe | 95.5 /100 | #108 | Exceptional 28.1% |
| Immigrants | Armenia | 95.2 /100 | #109 | Exceptional 28.1% |
| Croatians | 94.8 /100 | #110 | Exceptional 28.2% |
| Venezuelans | 94.5 /100 | #111 | Exceptional 28.2% |
| Immigrants | Kazakhstan | 94.5 /100 | #112 | Exceptional 28.2% |
| Immigrants | South Africa | 93.2 /100 | #113 | Exceptional 28.3% |
| Immigrants | Western Asia | 92.7 /100 | #114 | Exceptional 28.3% |
| Immigrants | Kuwait | 92.7 /100 | #115 | Exceptional 28.3% |
| Immigrants | Uganda | 92.5 /100 | #116 | Exceptional 28.3% |
| Australians | 92.5 /100 | #117 | Exceptional 28.3% |
Demographics Similar to Comanche by Single Mother Poverty
In terms of single mother poverty, the demographic groups most similar to Comanche are Immigrants from Mexico (34.0%, a difference of 0.18%), Immigrants from Congo (33.8%, a difference of 0.41%), Potawatomi (34.1%, a difference of 0.60%), Honduran (34.2%, a difference of 0.82%), and Immigrants from Central America (33.6%, a difference of 1.1%).
| Demographics | Rating | Rank | Single Mother Poverty |
| Hispanics or Latinos | 0.0 /100 | #300 | Tragic 33.3% |
| Immigrants | Somalia | 0.0 /100 | #301 | Tragic 33.4% |
| Arapaho | 0.0 /100 | #302 | Tragic 33.4% |
| Americans | 0.0 /100 | #303 | Tragic 33.5% |
| Mexicans | 0.0 /100 | #304 | Tragic 33.6% |
| Immigrants | Central America | 0.0 /100 | #305 | Tragic 33.6% |
| Immigrants | Congo | 0.0 /100 | #306 | Tragic 33.8% |
| Comanche | 0.0 /100 | #307 | Tragic 33.9% |
| Immigrants | Mexico | 0.0 /100 | #308 | Tragic 34.0% |
| Potawatomi | 0.0 /100 | #309 | Tragic 34.1% |
| Hondurans | 0.0 /100 | #310 | Tragic 34.2% |
| Alsatians | 0.0 /100 | #311 | Tragic 34.3% |
| Central American Indians | 0.0 /100 | #312 | Tragic 34.3% |
| Immigrants | Dominican Republic | 0.0 /100 | #313 | Tragic 34.4% |
| Chickasaw | 0.0 /100 | #314 | Tragic 34.4% |