Croatian vs Haitian Single Mother Poverty
COMPARE
Croatian
Haitian
Single Mother Poverty
Single Mother Poverty Comparison
Croatians
Haitians
28.2%
SINGLE MOTHER POVERTY
94.8/ 100
METRIC RATING
110th/ 347
METRIC RANK
29.8%
SINGLE MOTHER POVERTY
13.3/ 100
METRIC RATING
210th/ 347
METRIC RANK
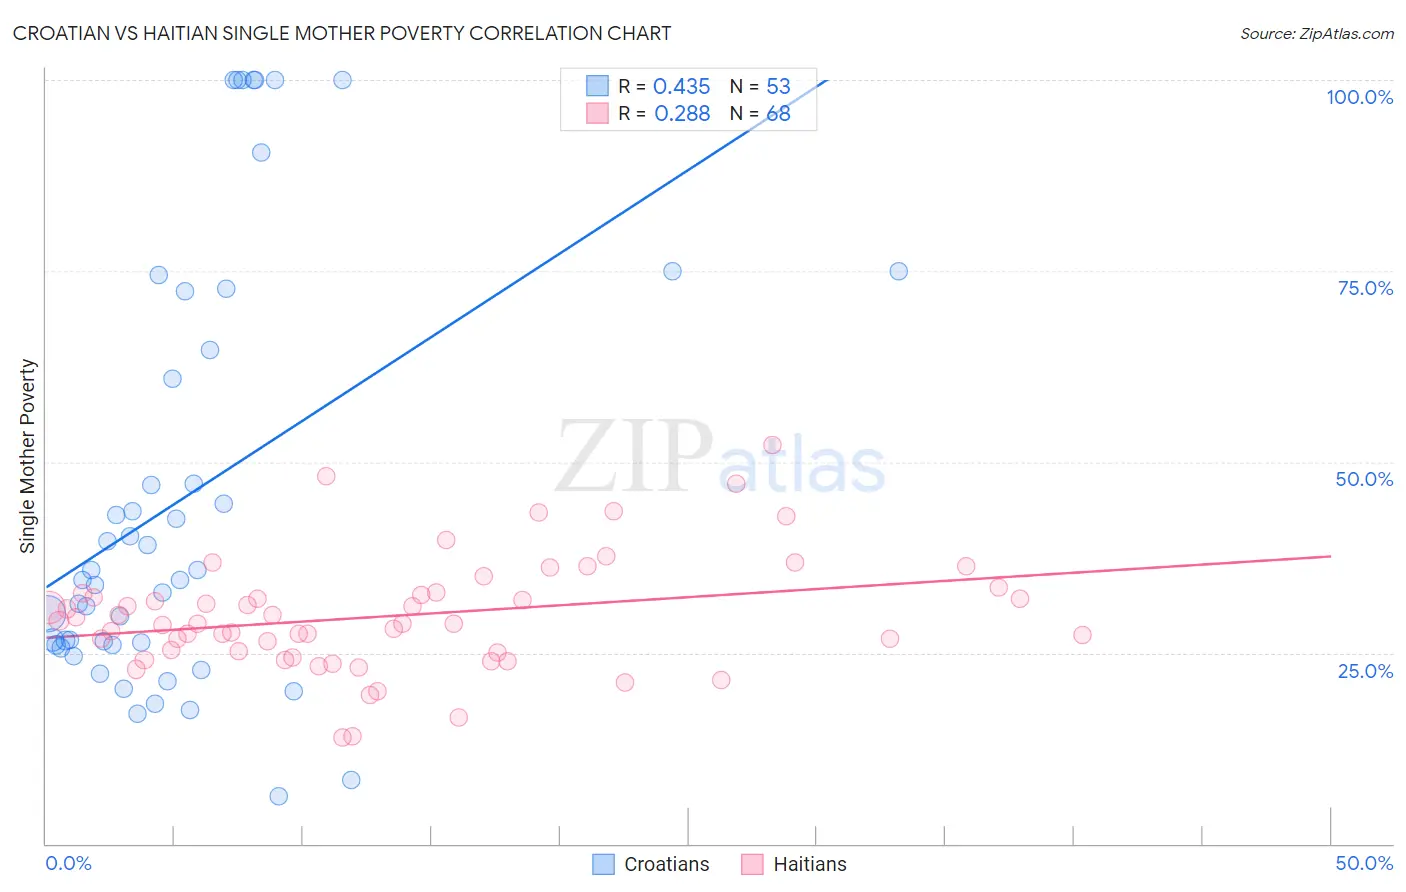
Croatian vs Haitian Single Mother Poverty Correlation Chart
The statistical analysis conducted on geographies consisting of 364,805,698 people shows a moderate positive correlation between the proportion of Croatians and poverty level among single mothers in the United States with a correlation coefficient (R) of 0.435 and weighted average of 28.2%. Similarly, the statistical analysis conducted on geographies consisting of 283,035,153 people shows a weak positive correlation between the proportion of Haitians and poverty level among single mothers in the United States with a correlation coefficient (R) of 0.288 and weighted average of 29.8%, a difference of 5.9%.
Single Mother Poverty Correlation Summary
| Measurement | Croatian | Haitian |
| Minimum | 6.2% | 13.8% |
| Maximum | 100.0% | 52.2% |
| Range | 93.8% | 38.4% |
| Mean | 45.5% | 29.8% |
| Median | 34.6% | 28.8% |
| Interquartile 25% (IQ1) | 26.0% | 25.1% |
| Interquartile 75% (IQ3) | 68.5% | 32.7% |
| Interquartile Range (IQR) | 42.5% | 7.6% |
| Standard Deviation (Sample) | 28.0% | 7.4% |
| Standard Deviation (Population) | 27.7% | 7.4% |
Similar Demographics by Single Mother Poverty
Demographics Similar to Croatians by Single Mother Poverty
In terms of single mother poverty, the demographic groups most similar to Croatians are Venezuelan (28.2%, a difference of 0.050%), Immigrants from Kazakhstan (28.2%, a difference of 0.060%), Immigrants from Armenia (28.1%, a difference of 0.12%), Immigrants from Zimbabwe (28.1%, a difference of 0.21%), and Immigrants from Venezuela (28.1%, a difference of 0.29%).
| Demographics | Rating | Rank | Single Mother Poverty |
| Immigrants | Northern Africa | 96.6 /100 | #103 | Exceptional 28.0% |
| Italians | 96.6 /100 | #104 | Exceptional 28.0% |
| Israelis | 96.5 /100 | #105 | Exceptional 28.0% |
| Ukrainians | 96.4 /100 | #106 | Exceptional 28.0% |
| Immigrants | Venezuela | 95.8 /100 | #107 | Exceptional 28.1% |
| Immigrants | Zimbabwe | 95.5 /100 | #108 | Exceptional 28.1% |
| Immigrants | Armenia | 95.2 /100 | #109 | Exceptional 28.1% |
| Croatians | 94.8 /100 | #110 | Exceptional 28.2% |
| Venezuelans | 94.5 /100 | #111 | Exceptional 28.2% |
| Immigrants | Kazakhstan | 94.5 /100 | #112 | Exceptional 28.2% |
| Immigrants | South Africa | 93.2 /100 | #113 | Exceptional 28.3% |
| Immigrants | Western Asia | 92.7 /100 | #114 | Exceptional 28.3% |
| Immigrants | Kuwait | 92.7 /100 | #115 | Exceptional 28.3% |
| Immigrants | Uganda | 92.5 /100 | #116 | Exceptional 28.3% |
| Australians | 92.5 /100 | #117 | Exceptional 28.3% |
Demographics Similar to Haitians by Single Mother Poverty
In terms of single mother poverty, the demographic groups most similar to Haitians are Guyanese (29.8%, a difference of 0.050%), Irish (29.8%, a difference of 0.060%), Nicaraguan (29.8%, a difference of 0.090%), Immigrants from Guyana (29.8%, a difference of 0.14%), and Immigrants from Thailand (29.9%, a difference of 0.14%).
| Demographics | Rating | Rank | Single Mother Poverty |
| Swiss | 17.2 /100 | #203 | Poor 29.7% |
| Immigrants | Immigrants | 16.6 /100 | #204 | Poor 29.7% |
| Czechoslovakians | 16.1 /100 | #205 | Poor 29.7% |
| Immigrants | Haiti | 15.8 /100 | #206 | Poor 29.7% |
| Immigrants | Panama | 15.5 /100 | #207 | Poor 29.8% |
| Immigrants | Guyana | 14.7 /100 | #208 | Poor 29.8% |
| Irish | 13.9 /100 | #209 | Poor 29.8% |
| Haitians | 13.3 /100 | #210 | Poor 29.8% |
| Guyanese | 12.8 /100 | #211 | Poor 29.8% |
| Nicaraguans | 12.4 /100 | #212 | Poor 29.8% |
| Immigrants | Thailand | 12.0 /100 | #213 | Poor 29.9% |
| Liberians | 11.7 /100 | #214 | Poor 29.9% |
| Jamaicans | 11.7 /100 | #215 | Poor 29.9% |
| Immigrants | Western Africa | 11.5 /100 | #216 | Poor 29.9% |
| Immigrants | Ghana | 11.3 /100 | #217 | Poor 29.9% |