Croatian vs Immigrants from Singapore Single Mother Poverty
COMPARE
Croatian
Immigrants from Singapore
Single Mother Poverty
Single Mother Poverty Comparison
Croatians
Immigrants from Singapore
28.2%
SINGLE MOTHER POVERTY
94.8/ 100
METRIC RATING
110th/ 347
METRIC RANK
25.8%
SINGLE MOTHER POVERTY
100.0/ 100
METRIC RATING
14th/ 347
METRIC RANK
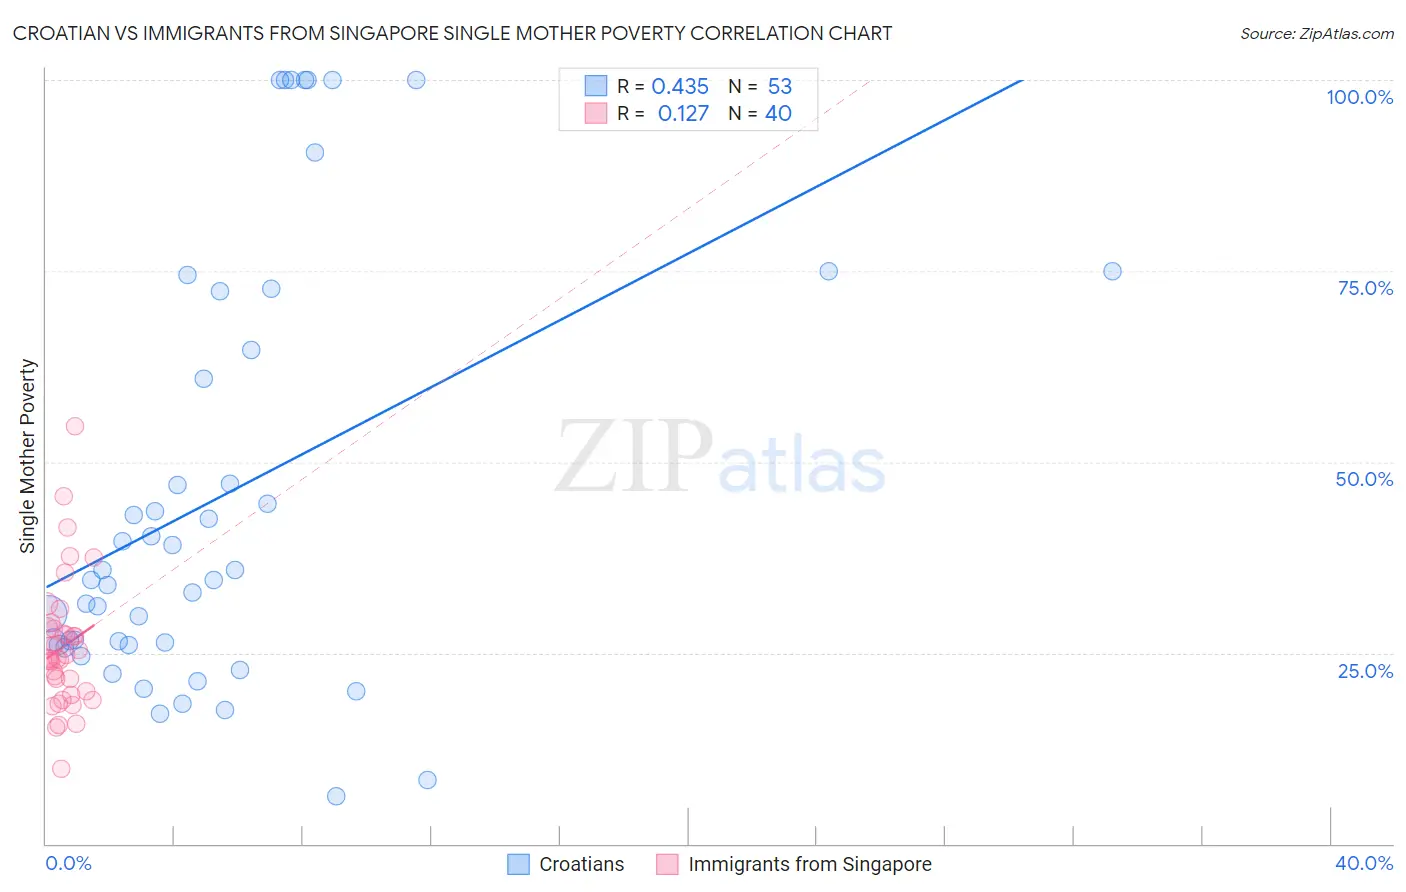
Croatian vs Immigrants from Singapore Single Mother Poverty Correlation Chart
The statistical analysis conducted on geographies consisting of 364,805,698 people shows a moderate positive correlation between the proportion of Croatians and poverty level among single mothers in the United States with a correlation coefficient (R) of 0.435 and weighted average of 28.2%. Similarly, the statistical analysis conducted on geographies consisting of 135,231,520 people shows a poor positive correlation between the proportion of Immigrants from Singapore and poverty level among single mothers in the United States with a correlation coefficient (R) of 0.127 and weighted average of 25.8%, a difference of 9.2%.
Single Mother Poverty Correlation Summary
| Measurement | Croatian | Immigrants from Singapore |
| Minimum | 6.2% | 9.9% |
| Maximum | 100.0% | 54.7% |
| Range | 93.8% | 44.8% |
| Mean | 45.5% | 25.8% |
| Median | 34.6% | 24.2% |
| Interquartile 25% (IQ1) | 26.0% | 19.7% |
| Interquartile 75% (IQ3) | 68.5% | 28.2% |
| Interquartile Range (IQR) | 42.5% | 8.5% |
| Standard Deviation (Sample) | 28.0% | 8.7% |
| Standard Deviation (Population) | 27.7% | 8.5% |
Similar Demographics by Single Mother Poverty
Demographics Similar to Croatians by Single Mother Poverty
In terms of single mother poverty, the demographic groups most similar to Croatians are Venezuelan (28.2%, a difference of 0.050%), Immigrants from Kazakhstan (28.2%, a difference of 0.060%), Immigrants from Armenia (28.1%, a difference of 0.12%), Immigrants from Zimbabwe (28.1%, a difference of 0.21%), and Immigrants from Venezuela (28.1%, a difference of 0.29%).
| Demographics | Rating | Rank | Single Mother Poverty |
| Immigrants | Northern Africa | 96.6 /100 | #103 | Exceptional 28.0% |
| Italians | 96.6 /100 | #104 | Exceptional 28.0% |
| Israelis | 96.5 /100 | #105 | Exceptional 28.0% |
| Ukrainians | 96.4 /100 | #106 | Exceptional 28.0% |
| Immigrants | Venezuela | 95.8 /100 | #107 | Exceptional 28.1% |
| Immigrants | Zimbabwe | 95.5 /100 | #108 | Exceptional 28.1% |
| Immigrants | Armenia | 95.2 /100 | #109 | Exceptional 28.1% |
| Croatians | 94.8 /100 | #110 | Exceptional 28.2% |
| Venezuelans | 94.5 /100 | #111 | Exceptional 28.2% |
| Immigrants | Kazakhstan | 94.5 /100 | #112 | Exceptional 28.2% |
| Immigrants | South Africa | 93.2 /100 | #113 | Exceptional 28.3% |
| Immigrants | Western Asia | 92.7 /100 | #114 | Exceptional 28.3% |
| Immigrants | Kuwait | 92.7 /100 | #115 | Exceptional 28.3% |
| Immigrants | Uganda | 92.5 /100 | #116 | Exceptional 28.3% |
| Australians | 92.5 /100 | #117 | Exceptional 28.3% |
Demographics Similar to Immigrants from Singapore by Single Mother Poverty
In terms of single mother poverty, the demographic groups most similar to Immigrants from Singapore are Indian (Asian) (25.8%, a difference of 0.15%), Immigrants from Ireland (25.8%, a difference of 0.18%), Bolivian (25.9%, a difference of 0.47%), Asian (26.0%, a difference of 0.65%), and Bhutanese (25.6%, a difference of 0.67%).
| Demographics | Rating | Rank | Single Mother Poverty |
| Chinese | 100.0 /100 | #7 | Exceptional 24.6% |
| Immigrants | Iran | 100.0 /100 | #8 | Exceptional 25.1% |
| Immigrants | Lithuania | 100.0 /100 | #9 | Exceptional 25.2% |
| Immigrants | South Central Asia | 100.0 /100 | #10 | Exceptional 25.3% |
| Iranians | 100.0 /100 | #11 | Exceptional 25.5% |
| Bhutanese | 100.0 /100 | #12 | Exceptional 25.6% |
| Indians (Asian) | 100.0 /100 | #13 | Exceptional 25.8% |
| Immigrants | Singapore | 100.0 /100 | #14 | Exceptional 25.8% |
| Immigrants | Ireland | 100.0 /100 | #15 | Exceptional 25.8% |
| Bolivians | 100.0 /100 | #16 | Exceptional 25.9% |
| Asians | 100.0 /100 | #17 | Exceptional 26.0% |
| Immigrants | Pakistan | 100.0 /100 | #18 | Exceptional 26.0% |
| Immigrants | Eastern Asia | 100.0 /100 | #19 | Exceptional 26.1% |
| Immigrants | China | 100.0 /100 | #20 | Exceptional 26.1% |
| Immigrants | Bolivia | 100.0 /100 | #21 | Exceptional 26.2% |