Immigrants from Austria vs Comanche Single Mother Poverty
COMPARE
Immigrants from Austria
Comanche
Single Mother Poverty
Single Mother Poverty Comparison
Immigrants from Austria
Comanche
28.4%
SINGLE MOTHER POVERTY
90.3/ 100
METRIC RATING
131st/ 347
METRIC RANK
33.9%
SINGLE MOTHER POVERTY
0.0/ 100
METRIC RATING
307th/ 347
METRIC RANK
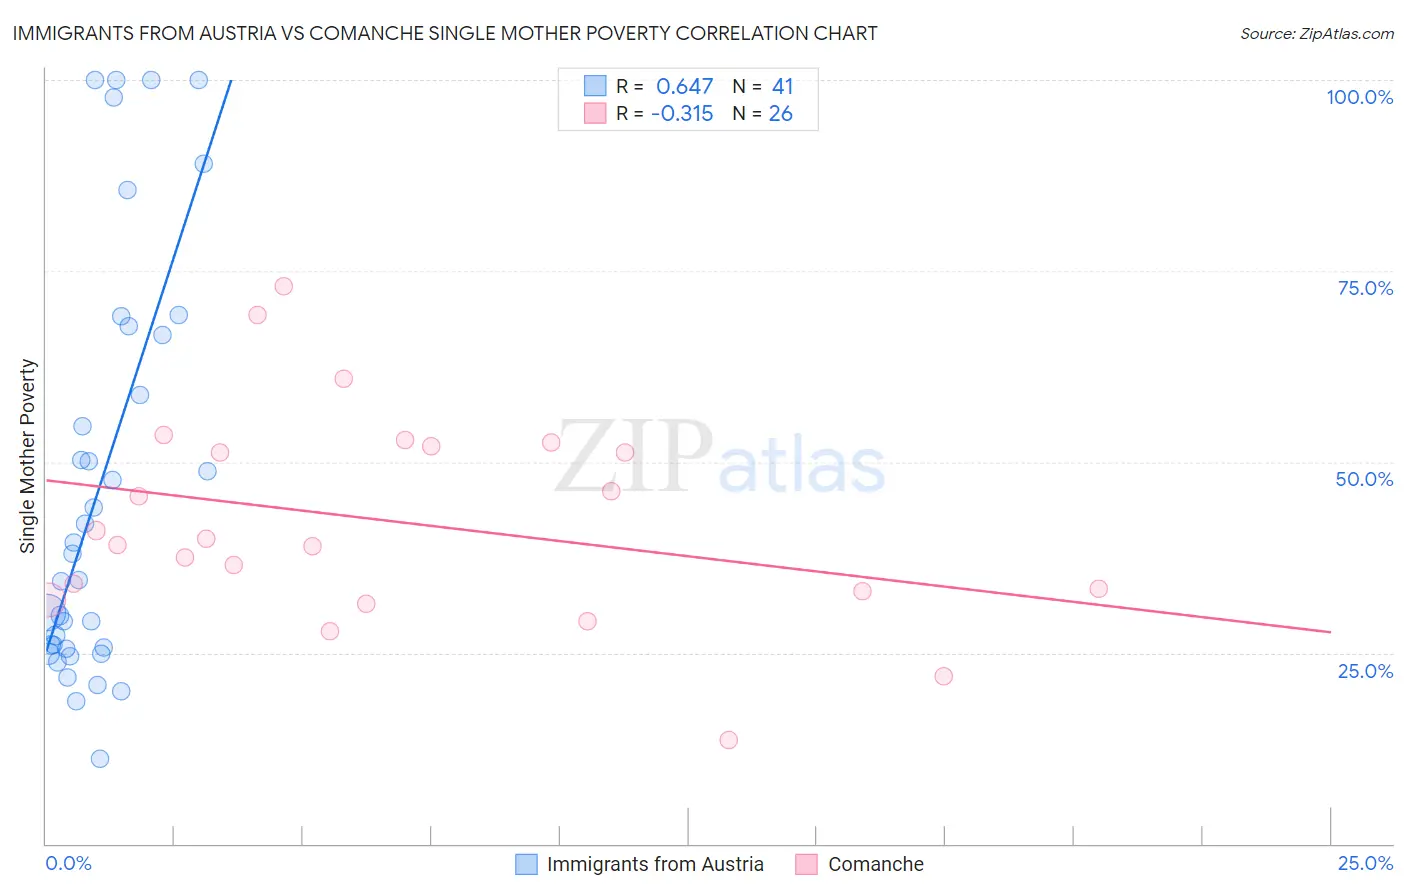
Immigrants from Austria vs Comanche Single Mother Poverty Correlation Chart
The statistical analysis conducted on geographies consisting of 164,839,787 people shows a significant positive correlation between the proportion of Immigrants from Austria and poverty level among single mothers in the United States with a correlation coefficient (R) of 0.647 and weighted average of 28.4%. Similarly, the statistical analysis conducted on geographies consisting of 109,063,480 people shows a mild negative correlation between the proportion of Comanche and poverty level among single mothers in the United States with a correlation coefficient (R) of -0.315 and weighted average of 33.9%, a difference of 19.5%.
Single Mother Poverty Correlation Summary
| Measurement | Immigrants from Austria | Comanche |
| Minimum | 11.1% | 13.6% |
| Maximum | 100.0% | 73.0% |
| Range | 88.9% | 59.3% |
| Mean | 47.0% | 42.2% |
| Median | 38.0% | 39.6% |
| Interquartile 25% (IQ1) | 25.6% | 33.1% |
| Interquartile 75% (IQ3) | 67.2% | 52.0% |
| Interquartile Range (IQR) | 41.6% | 18.9% |
| Standard Deviation (Sample) | 27.0% | 13.9% |
| Standard Deviation (Population) | 26.7% | 13.6% |
Similar Demographics by Single Mother Poverty
Demographics Similar to Immigrants from Austria by Single Mother Poverty
In terms of single mother poverty, the demographic groups most similar to Immigrants from Austria are Norwegian (28.4%, a difference of 0.010%), South American (28.4%, a difference of 0.020%), Immigrants from England (28.4%, a difference of 0.040%), Polish (28.4%, a difference of 0.070%), and Immigrants from Chile (28.4%, a difference of 0.080%).
| Demographics | Rating | Rank | Single Mother Poverty |
| Immigrants | Switzerland | 91.7 /100 | #124 | Exceptional 28.3% |
| Kenyans | 90.9 /100 | #125 | Exceptional 28.4% |
| Immigrants | Chile | 90.8 /100 | #126 | Exceptional 28.4% |
| Poles | 90.8 /100 | #127 | Exceptional 28.4% |
| Immigrants | England | 90.5 /100 | #128 | Exceptional 28.4% |
| South Americans | 90.4 /100 | #129 | Exceptional 28.4% |
| Norwegians | 90.4 /100 | #130 | Exceptional 28.4% |
| Immigrants | Austria | 90.3 /100 | #131 | Exceptional 28.4% |
| Immigrants | Morocco | 89.5 /100 | #132 | Excellent 28.4% |
| Swedes | 89.4 /100 | #133 | Excellent 28.4% |
| Immigrants | Southern Europe | 89.2 /100 | #134 | Excellent 28.4% |
| Immigrants | Spain | 89.2 /100 | #135 | Excellent 28.4% |
| Native Hawaiians | 88.9 /100 | #136 | Excellent 28.4% |
| Immigrants | Canada | 88.9 /100 | #137 | Excellent 28.4% |
| Immigrants | Belgium | 88.5 /100 | #138 | Excellent 28.5% |
Demographics Similar to Comanche by Single Mother Poverty
In terms of single mother poverty, the demographic groups most similar to Comanche are Immigrants from Mexico (34.0%, a difference of 0.18%), Immigrants from Congo (33.8%, a difference of 0.41%), Potawatomi (34.1%, a difference of 0.60%), Honduran (34.2%, a difference of 0.82%), and Immigrants from Central America (33.6%, a difference of 1.1%).
| Demographics | Rating | Rank | Single Mother Poverty |
| Hispanics or Latinos | 0.0 /100 | #300 | Tragic 33.3% |
| Immigrants | Somalia | 0.0 /100 | #301 | Tragic 33.4% |
| Arapaho | 0.0 /100 | #302 | Tragic 33.4% |
| Americans | 0.0 /100 | #303 | Tragic 33.5% |
| Mexicans | 0.0 /100 | #304 | Tragic 33.6% |
| Immigrants | Central America | 0.0 /100 | #305 | Tragic 33.6% |
| Immigrants | Congo | 0.0 /100 | #306 | Tragic 33.8% |
| Comanche | 0.0 /100 | #307 | Tragic 33.9% |
| Immigrants | Mexico | 0.0 /100 | #308 | Tragic 34.0% |
| Potawatomi | 0.0 /100 | #309 | Tragic 34.1% |
| Hondurans | 0.0 /100 | #310 | Tragic 34.2% |
| Alsatians | 0.0 /100 | #311 | Tragic 34.3% |
| Central American Indians | 0.0 /100 | #312 | Tragic 34.3% |
| Immigrants | Dominican Republic | 0.0 /100 | #313 | Tragic 34.4% |
| Chickasaw | 0.0 /100 | #314 | Tragic 34.4% |