Croatian vs Immigrants from Kenya Single Mother Poverty
COMPARE
Croatian
Immigrants from Kenya
Single Mother Poverty
Single Mother Poverty Comparison
Croatians
Immigrants from Kenya
28.2%
SINGLE MOTHER POVERTY
94.8/ 100
METRIC RATING
110th/ 347
METRIC RANK
28.9%
SINGLE MOTHER POVERTY
65.9/ 100
METRIC RATING
164th/ 347
METRIC RANK
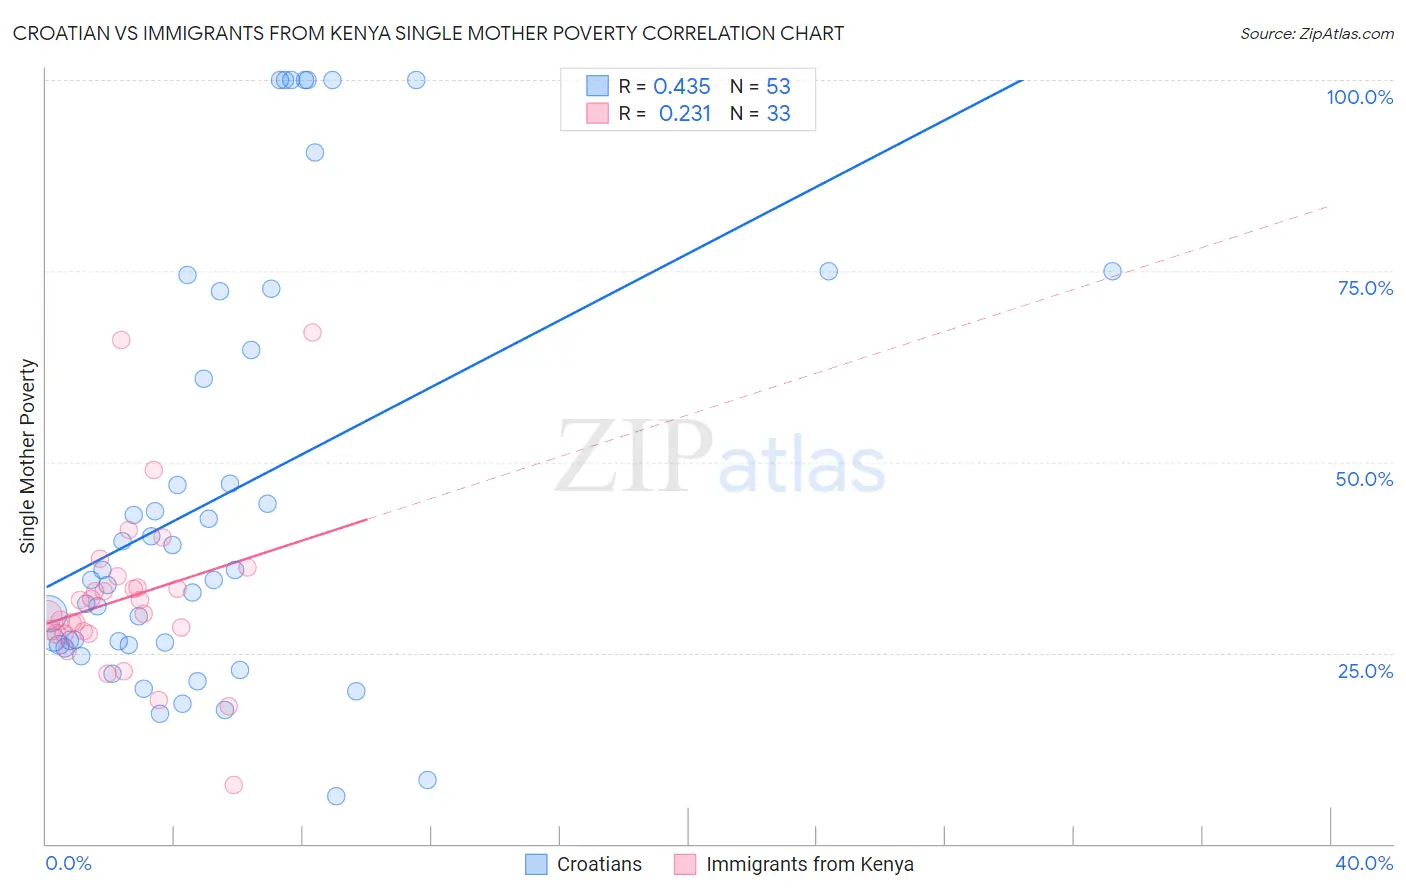
Croatian vs Immigrants from Kenya Single Mother Poverty Correlation Chart
The statistical analysis conducted on geographies consisting of 364,805,698 people shows a moderate positive correlation between the proportion of Croatians and poverty level among single mothers in the United States with a correlation coefficient (R) of 0.435 and weighted average of 28.2%. Similarly, the statistical analysis conducted on geographies consisting of 215,478,455 people shows a weak positive correlation between the proportion of Immigrants from Kenya and poverty level among single mothers in the United States with a correlation coefficient (R) of 0.231 and weighted average of 28.9%, a difference of 2.8%.
Single Mother Poverty Correlation Summary
| Measurement | Croatian | Immigrants from Kenya |
| Minimum | 6.2% | 7.7% |
| Maximum | 100.0% | 66.9% |
| Range | 93.8% | 59.2% |
| Mean | 45.5% | 32.2% |
| Median | 34.6% | 30.0% |
| Interquartile 25% (IQ1) | 26.0% | 27.6% |
| Interquartile 75% (IQ3) | 68.5% | 34.3% |
| Interquartile Range (IQR) | 42.5% | 6.8% |
| Standard Deviation (Sample) | 28.0% | 11.5% |
| Standard Deviation (Population) | 27.7% | 11.3% |
Similar Demographics by Single Mother Poverty
Demographics Similar to Croatians by Single Mother Poverty
In terms of single mother poverty, the demographic groups most similar to Croatians are Venezuelan (28.2%, a difference of 0.050%), Immigrants from Kazakhstan (28.2%, a difference of 0.060%), Immigrants from Armenia (28.1%, a difference of 0.12%), Immigrants from Zimbabwe (28.1%, a difference of 0.21%), and Immigrants from Venezuela (28.1%, a difference of 0.29%).
| Demographics | Rating | Rank | Single Mother Poverty |
| Immigrants | Northern Africa | 96.6 /100 | #103 | Exceptional 28.0% |
| Italians | 96.6 /100 | #104 | Exceptional 28.0% |
| Israelis | 96.5 /100 | #105 | Exceptional 28.0% |
| Ukrainians | 96.4 /100 | #106 | Exceptional 28.0% |
| Immigrants | Venezuela | 95.8 /100 | #107 | Exceptional 28.1% |
| Immigrants | Zimbabwe | 95.5 /100 | #108 | Exceptional 28.1% |
| Immigrants | Armenia | 95.2 /100 | #109 | Exceptional 28.1% |
| Croatians | 94.8 /100 | #110 | Exceptional 28.2% |
| Venezuelans | 94.5 /100 | #111 | Exceptional 28.2% |
| Immigrants | Kazakhstan | 94.5 /100 | #112 | Exceptional 28.2% |
| Immigrants | South Africa | 93.2 /100 | #113 | Exceptional 28.3% |
| Immigrants | Western Asia | 92.7 /100 | #114 | Exceptional 28.3% |
| Immigrants | Kuwait | 92.7 /100 | #115 | Exceptional 28.3% |
| Immigrants | Uganda | 92.5 /100 | #116 | Exceptional 28.3% |
| Australians | 92.5 /100 | #117 | Exceptional 28.3% |
Demographics Similar to Immigrants from Kenya by Single Mother Poverty
In terms of single mother poverty, the demographic groups most similar to Immigrants from Kenya are Immigrants from Nigeria (28.9%, a difference of 0.0%), Scandinavian (28.9%, a difference of 0.020%), Immigrants from Cambodia (28.9%, a difference of 0.040%), Japanese (28.9%, a difference of 0.11%), and Czech (28.9%, a difference of 0.14%).
| Demographics | Rating | Rank | Single Mother Poverty |
| Immigrants | Western Europe | 71.1 /100 | #157 | Good 28.9% |
| Immigrants | Hungary | 70.6 /100 | #158 | Good 28.9% |
| Czechs | 68.4 /100 | #159 | Good 28.9% |
| Japanese | 68.0 /100 | #160 | Good 28.9% |
| Immigrants | Cambodia | 66.6 /100 | #161 | Good 28.9% |
| Scandinavians | 66.2 /100 | #162 | Good 28.9% |
| Immigrants | Nigeria | 65.9 /100 | #163 | Good 28.9% |
| Immigrants | Kenya | 65.9 /100 | #164 | Good 28.9% |
| Arabs | 60.7 /100 | #165 | Good 29.0% |
| Inupiat | 60.4 /100 | #166 | Good 29.0% |
| Costa Ricans | 58.4 /100 | #167 | Average 29.0% |
| Europeans | 57.6 /100 | #168 | Average 29.1% |
| Immigrants | Uruguay | 57.2 /100 | #169 | Average 29.1% |
| New Zealanders | 55.1 /100 | #170 | Average 29.1% |
| Puget Sound Salish | 55.1 /100 | #171 | Average 29.1% |