Croatian vs British West Indian Single Mother Poverty
COMPARE
Croatian
British West Indian
Single Mother Poverty
Single Mother Poverty Comparison
Croatians
British West Indians
28.2%
SINGLE MOTHER POVERTY
94.8/ 100
METRIC RATING
110th/ 347
METRIC RANK
31.5%
SINGLE MOTHER POVERTY
0.1/ 100
METRIC RATING
270th/ 347
METRIC RANK
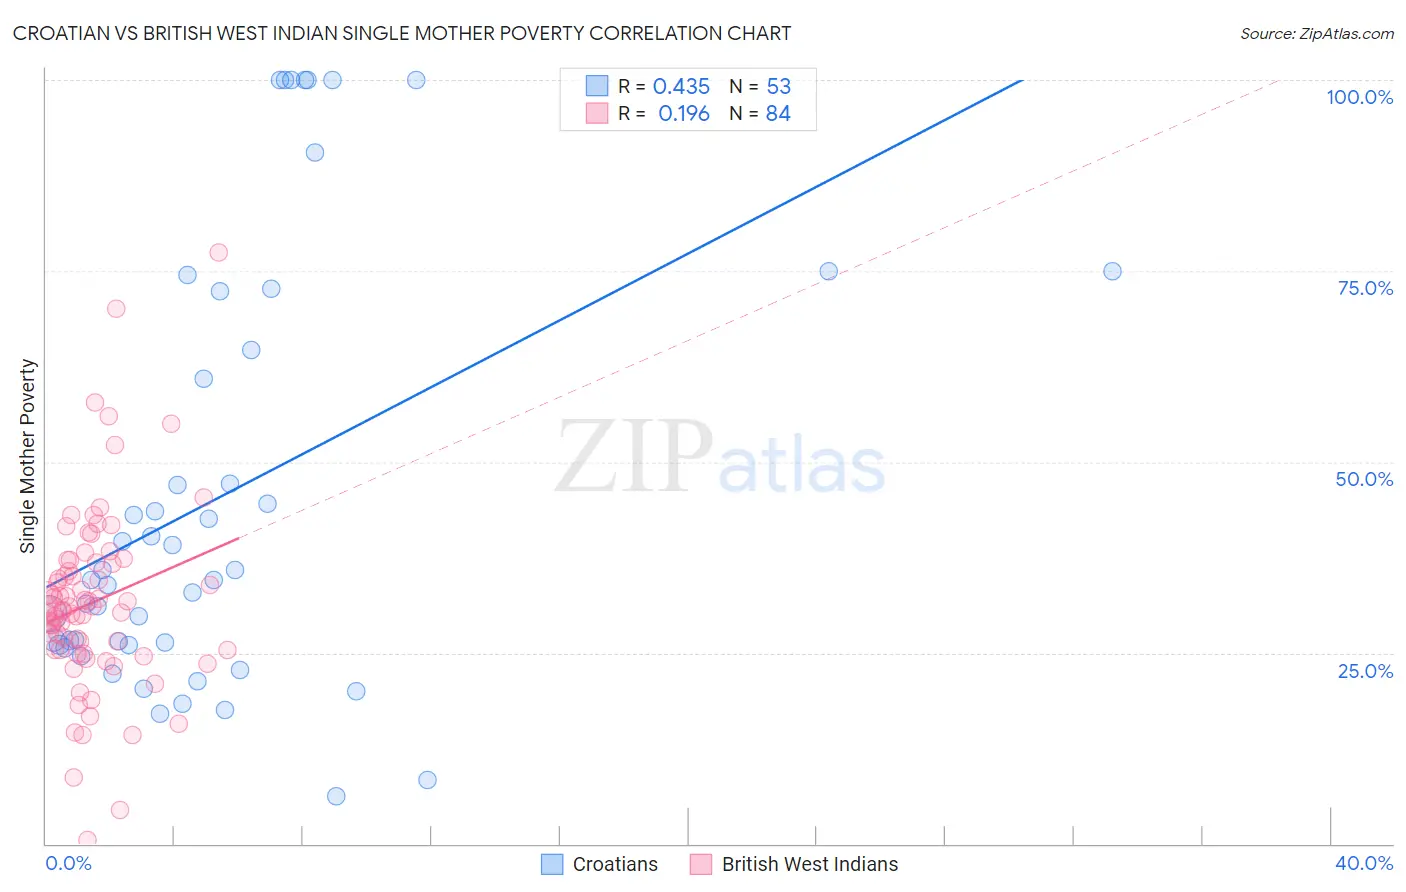
Croatian vs British West Indian Single Mother Poverty Correlation Chart
The statistical analysis conducted on geographies consisting of 364,805,698 people shows a moderate positive correlation between the proportion of Croatians and poverty level among single mothers in the United States with a correlation coefficient (R) of 0.435 and weighted average of 28.2%. Similarly, the statistical analysis conducted on geographies consisting of 151,437,686 people shows a poor positive correlation between the proportion of British West Indians and poverty level among single mothers in the United States with a correlation coefficient (R) of 0.196 and weighted average of 31.5%, a difference of 11.9%.
Single Mother Poverty Correlation Summary
| Measurement | Croatian | British West Indian |
| Minimum | 6.2% | 0.48% |
| Maximum | 100.0% | 77.3% |
| Range | 93.8% | 76.9% |
| Mean | 45.5% | 31.6% |
| Median | 34.6% | 30.9% |
| Interquartile 25% (IQ1) | 26.0% | 25.4% |
| Interquartile 75% (IQ3) | 68.5% | 36.7% |
| Interquartile Range (IQR) | 42.5% | 11.3% |
| Standard Deviation (Sample) | 28.0% | 12.1% |
| Standard Deviation (Population) | 27.7% | 12.0% |
Similar Demographics by Single Mother Poverty
Demographics Similar to Croatians by Single Mother Poverty
In terms of single mother poverty, the demographic groups most similar to Croatians are Venezuelan (28.2%, a difference of 0.050%), Immigrants from Kazakhstan (28.2%, a difference of 0.060%), Immigrants from Armenia (28.1%, a difference of 0.12%), Immigrants from Zimbabwe (28.1%, a difference of 0.21%), and Immigrants from Venezuela (28.1%, a difference of 0.29%).
| Demographics | Rating | Rank | Single Mother Poverty |
| Immigrants | Northern Africa | 96.6 /100 | #103 | Exceptional 28.0% |
| Italians | 96.6 /100 | #104 | Exceptional 28.0% |
| Israelis | 96.5 /100 | #105 | Exceptional 28.0% |
| Ukrainians | 96.4 /100 | #106 | Exceptional 28.0% |
| Immigrants | Venezuela | 95.8 /100 | #107 | Exceptional 28.1% |
| Immigrants | Zimbabwe | 95.5 /100 | #108 | Exceptional 28.1% |
| Immigrants | Armenia | 95.2 /100 | #109 | Exceptional 28.1% |
| Croatians | 94.8 /100 | #110 | Exceptional 28.2% |
| Venezuelans | 94.5 /100 | #111 | Exceptional 28.2% |
| Immigrants | Kazakhstan | 94.5 /100 | #112 | Exceptional 28.2% |
| Immigrants | South Africa | 93.2 /100 | #113 | Exceptional 28.3% |
| Immigrants | Western Asia | 92.7 /100 | #114 | Exceptional 28.3% |
| Immigrants | Kuwait | 92.7 /100 | #115 | Exceptional 28.3% |
| Immigrants | Uganda | 92.5 /100 | #116 | Exceptional 28.3% |
| Australians | 92.5 /100 | #117 | Exceptional 28.3% |
Demographics Similar to British West Indians by Single Mother Poverty
In terms of single mother poverty, the demographic groups most similar to British West Indians are Scotch-Irish (31.5%, a difference of 0.050%), Immigrants from Senegal (31.5%, a difference of 0.090%), Immigrants from Cabo Verde (31.6%, a difference of 0.24%), Immigrants from Micronesia (31.6%, a difference of 0.26%), and Immigrants from Belize (31.4%, a difference of 0.27%).
| Demographics | Rating | Rank | Single Mother Poverty |
| Bahamians | 0.2 /100 | #263 | Tragic 31.3% |
| Immigrants | Ecuador | 0.2 /100 | #264 | Tragic 31.3% |
| German Russians | 0.2 /100 | #265 | Tragic 31.3% |
| Sub-Saharan Africans | 0.2 /100 | #266 | Tragic 31.4% |
| Immigrants | Belize | 0.2 /100 | #267 | Tragic 31.4% |
| Immigrants | Senegal | 0.1 /100 | #268 | Tragic 31.5% |
| Scotch-Irish | 0.1 /100 | #269 | Tragic 31.5% |
| British West Indians | 0.1 /100 | #270 | Tragic 31.5% |
| Immigrants | Cabo Verde | 0.1 /100 | #271 | Tragic 31.6% |
| Immigrants | Micronesia | 0.1 /100 | #272 | Tragic 31.6% |
| Fijians | 0.1 /100 | #273 | Tragic 31.6% |
| Bangladeshis | 0.1 /100 | #274 | Tragic 31.7% |
| Central Americans | 0.1 /100 | #275 | Tragic 31.8% |
| Delaware | 0.0 /100 | #276 | Tragic 31.8% |
| Mexican American Indians | 0.0 /100 | #277 | Tragic 31.9% |