Pueblo vs Comanche Single Mother Poverty
COMPARE
Pueblo
Comanche
Single Mother Poverty
Single Mother Poverty Comparison
Pueblo
Comanche
37.2%
SINGLE MOTHER POVERTY
0.0/ 100
METRIC RATING
334th/ 347
METRIC RANK
33.9%
SINGLE MOTHER POVERTY
0.0/ 100
METRIC RATING
307th/ 347
METRIC RANK
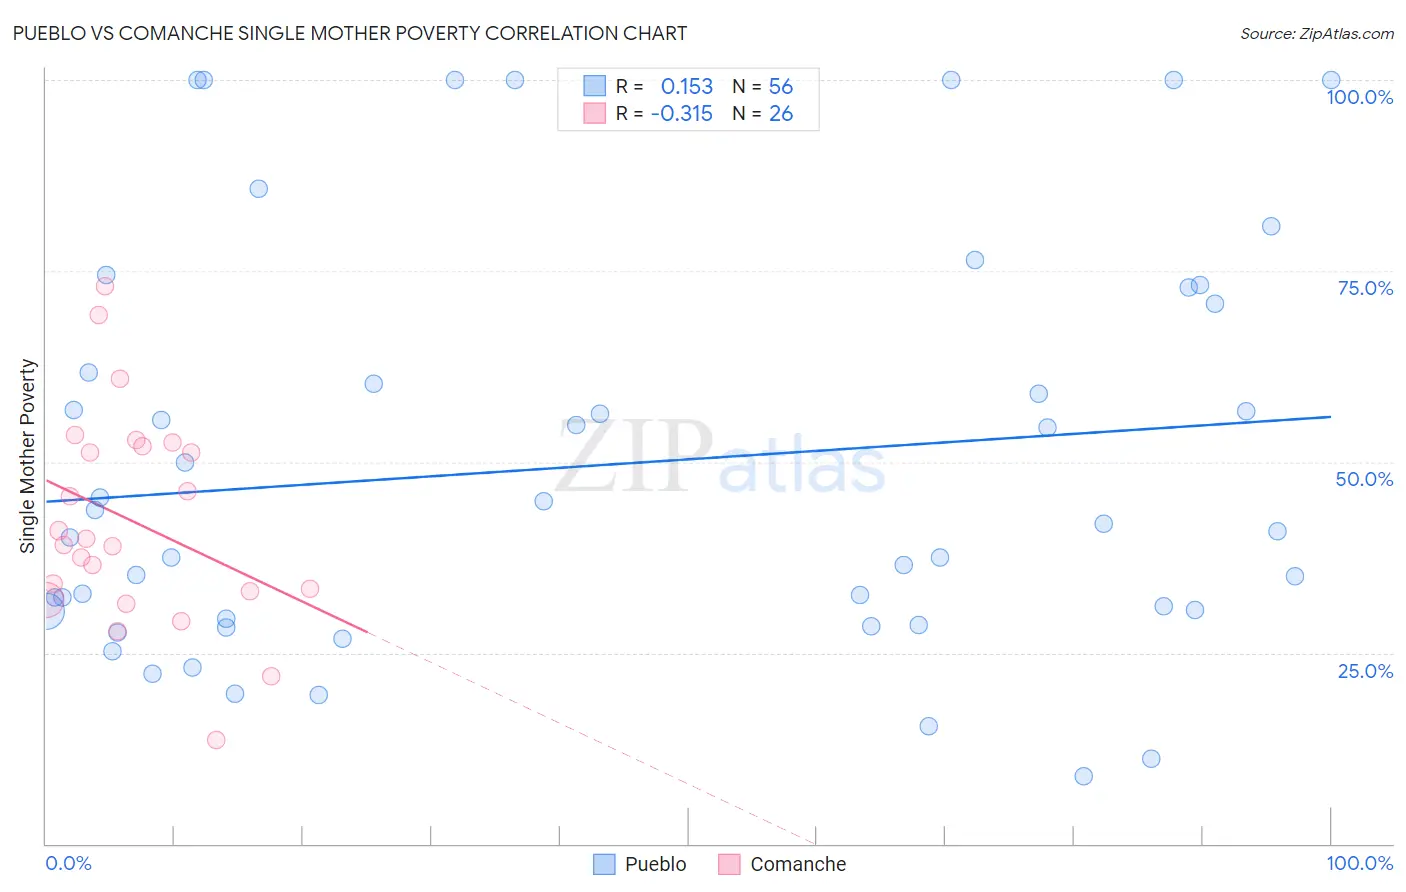
Pueblo vs Comanche Single Mother Poverty Correlation Chart
The statistical analysis conducted on geographies consisting of 119,257,256 people shows a poor positive correlation between the proportion of Pueblo and poverty level among single mothers in the United States with a correlation coefficient (R) of 0.153 and weighted average of 37.2%. Similarly, the statistical analysis conducted on geographies consisting of 109,063,480 people shows a mild negative correlation between the proportion of Comanche and poverty level among single mothers in the United States with a correlation coefficient (R) of -0.315 and weighted average of 33.9%, a difference of 9.7%.
Single Mother Poverty Correlation Summary
| Measurement | Pueblo | Comanche |
| Minimum | 8.8% | 13.6% |
| Maximum | 100.0% | 73.0% |
| Range | 91.2% | 59.3% |
| Mean | 49.5% | 42.2% |
| Median | 41.4% | 39.6% |
| Interquartile 25% (IQ1) | 30.0% | 33.1% |
| Interquartile 75% (IQ3) | 66.2% | 52.0% |
| Interquartile Range (IQR) | 36.2% | 18.9% |
| Standard Deviation (Sample) | 26.2% | 13.9% |
| Standard Deviation (Population) | 26.0% | 13.6% |
Similar Demographics by Single Mother Poverty
Demographics Similar to Pueblo by Single Mother Poverty
In terms of single mother poverty, the demographic groups most similar to Pueblo are Menominee (37.1%, a difference of 0.37%), Dutch West Indian (36.8%, a difference of 1.2%), Creek (36.7%, a difference of 1.4%), Yuman (37.8%, a difference of 1.5%), and Native/Alaskan (36.6%, a difference of 1.6%).
| Demographics | Rating | Rank | Single Mother Poverty |
| Yakama | 0.0 /100 | #327 | Tragic 36.4% |
| Choctaw | 0.0 /100 | #328 | Tragic 36.4% |
| Apache | 0.0 /100 | #329 | Tragic 36.6% |
| Natives/Alaskans | 0.0 /100 | #330 | Tragic 36.6% |
| Creek | 0.0 /100 | #331 | Tragic 36.7% |
| Dutch West Indians | 0.0 /100 | #332 | Tragic 36.8% |
| Menominee | 0.0 /100 | #333 | Tragic 37.1% |
| Pueblo | 0.0 /100 | #334 | Tragic 37.2% |
| Yuman | 0.0 /100 | #335 | Tragic 37.8% |
| Cheyenne | 0.0 /100 | #336 | Tragic 38.5% |
| Immigrants | Yemen | 0.0 /100 | #337 | Tragic 38.5% |
| Pima | 0.0 /100 | #338 | Tragic 38.6% |
| Crow | 0.0 /100 | #339 | Tragic 38.6% |
| Sioux | 0.0 /100 | #340 | Tragic 38.8% |
| Colville | 0.0 /100 | #341 | Tragic 39.3% |
Demographics Similar to Comanche by Single Mother Poverty
In terms of single mother poverty, the demographic groups most similar to Comanche are Immigrants from Mexico (34.0%, a difference of 0.18%), Immigrants from Congo (33.8%, a difference of 0.41%), Potawatomi (34.1%, a difference of 0.60%), Honduran (34.2%, a difference of 0.82%), and Immigrants from Central America (33.6%, a difference of 1.1%).
| Demographics | Rating | Rank | Single Mother Poverty |
| Hispanics or Latinos | 0.0 /100 | #300 | Tragic 33.3% |
| Immigrants | Somalia | 0.0 /100 | #301 | Tragic 33.4% |
| Arapaho | 0.0 /100 | #302 | Tragic 33.4% |
| Americans | 0.0 /100 | #303 | Tragic 33.5% |
| Mexicans | 0.0 /100 | #304 | Tragic 33.6% |
| Immigrants | Central America | 0.0 /100 | #305 | Tragic 33.6% |
| Immigrants | Congo | 0.0 /100 | #306 | Tragic 33.8% |
| Comanche | 0.0 /100 | #307 | Tragic 33.9% |
| Immigrants | Mexico | 0.0 /100 | #308 | Tragic 34.0% |
| Potawatomi | 0.0 /100 | #309 | Tragic 34.1% |
| Hondurans | 0.0 /100 | #310 | Tragic 34.2% |
| Alsatians | 0.0 /100 | #311 | Tragic 34.3% |
| Central American Indians | 0.0 /100 | #312 | Tragic 34.3% |
| Immigrants | Dominican Republic | 0.0 /100 | #313 | Tragic 34.4% |
| Chickasaw | 0.0 /100 | #314 | Tragic 34.4% |