Moroccan vs Comanche Single Mother Poverty
COMPARE
Moroccan
Comanche
Single Mother Poverty
Single Mother Poverty Comparison
Moroccans
Comanche
29.5%
SINGLE MOTHER POVERTY
28.6/ 100
METRIC RATING
192nd/ 347
METRIC RANK
33.9%
SINGLE MOTHER POVERTY
0.0/ 100
METRIC RATING
307th/ 347
METRIC RANK
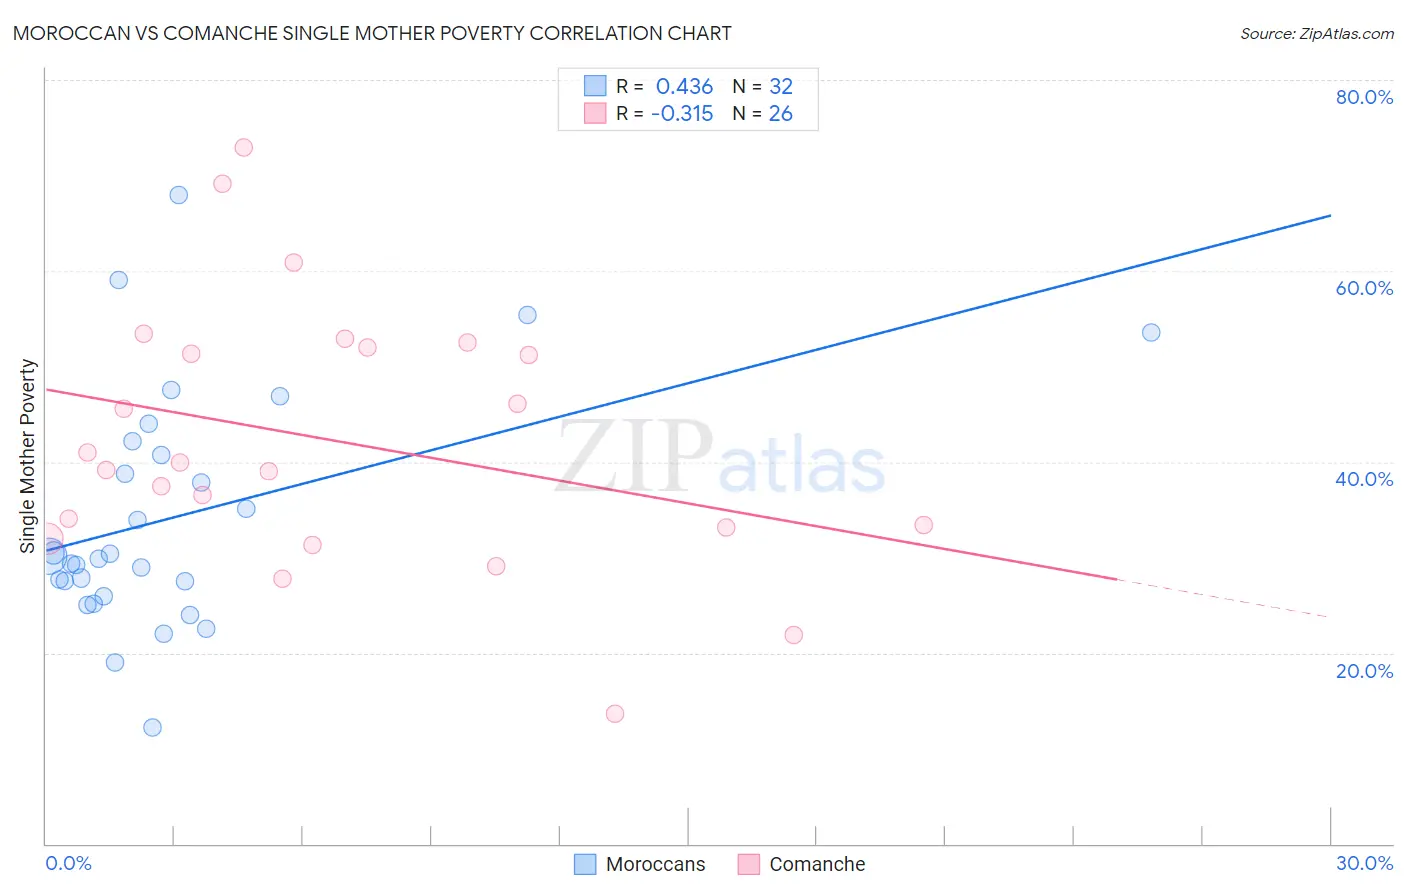
Moroccan vs Comanche Single Mother Poverty Correlation Chart
The statistical analysis conducted on geographies consisting of 199,317,261 people shows a moderate positive correlation between the proportion of Moroccans and poverty level among single mothers in the United States with a correlation coefficient (R) of 0.436 and weighted average of 29.5%. Similarly, the statistical analysis conducted on geographies consisting of 109,063,480 people shows a mild negative correlation between the proportion of Comanche and poverty level among single mothers in the United States with a correlation coefficient (R) of -0.315 and weighted average of 33.9%, a difference of 15.0%.
Single Mother Poverty Correlation Summary
| Measurement | Moroccan | Comanche |
| Minimum | 12.2% | 13.6% |
| Maximum | 68.0% | 73.0% |
| Range | 55.9% | 59.3% |
| Mean | 34.3% | 42.2% |
| Median | 30.0% | 39.6% |
| Interquartile 25% (IQ1) | 26.7% | 33.1% |
| Interquartile 75% (IQ3) | 41.5% | 52.0% |
| Interquartile Range (IQR) | 14.8% | 18.9% |
| Standard Deviation (Sample) | 12.5% | 13.9% |
| Standard Deviation (Population) | 12.3% | 13.6% |
Similar Demographics by Single Mother Poverty
Demographics Similar to Moroccans by Single Mother Poverty
In terms of single mother poverty, the demographic groups most similar to Moroccans are Basque (29.5%, a difference of 0.020%), Immigrants from Trinidad and Tobago (29.5%, a difference of 0.030%), Immigrants from Germany (29.5%, a difference of 0.10%), Icelander (29.5%, a difference of 0.15%), and Immigrants from Africa (29.4%, a difference of 0.17%).
| Demographics | Rating | Rank | Single Mother Poverty |
| Ghanaians | 36.8 /100 | #185 | Fair 29.4% |
| Yugoslavians | 36.0 /100 | #186 | Fair 29.4% |
| Lebanese | 32.5 /100 | #187 | Fair 29.4% |
| Guamanians/Chamorros | 31.8 /100 | #188 | Fair 29.4% |
| Immigrants | Africa | 31.6 /100 | #189 | Fair 29.4% |
| Immigrants | Germany | 30.4 /100 | #190 | Fair 29.5% |
| Immigrants | Trinidad and Tobago | 29.2 /100 | #191 | Fair 29.5% |
| Moroccans | 28.6 /100 | #192 | Fair 29.5% |
| Basques | 28.3 /100 | #193 | Fair 29.5% |
| Icelanders | 26.1 /100 | #194 | Fair 29.5% |
| Slavs | 24.5 /100 | #195 | Fair 29.6% |
| Spanish American Indians | 23.4 /100 | #196 | Fair 29.6% |
| Immigrants | Jamaica | 22.0 /100 | #197 | Fair 29.6% |
| Trinidadians and Tobagonians | 21.7 /100 | #198 | Fair 29.6% |
| Cubans | 20.8 /100 | #199 | Fair 29.6% |
Demographics Similar to Comanche by Single Mother Poverty
In terms of single mother poverty, the demographic groups most similar to Comanche are Immigrants from Mexico (34.0%, a difference of 0.18%), Immigrants from Congo (33.8%, a difference of 0.41%), Potawatomi (34.1%, a difference of 0.60%), Honduran (34.2%, a difference of 0.82%), and Immigrants from Central America (33.6%, a difference of 1.1%).
| Demographics | Rating | Rank | Single Mother Poverty |
| Hispanics or Latinos | 0.0 /100 | #300 | Tragic 33.3% |
| Immigrants | Somalia | 0.0 /100 | #301 | Tragic 33.4% |
| Arapaho | 0.0 /100 | #302 | Tragic 33.4% |
| Americans | 0.0 /100 | #303 | Tragic 33.5% |
| Mexicans | 0.0 /100 | #304 | Tragic 33.6% |
| Immigrants | Central America | 0.0 /100 | #305 | Tragic 33.6% |
| Immigrants | Congo | 0.0 /100 | #306 | Tragic 33.8% |
| Comanche | 0.0 /100 | #307 | Tragic 33.9% |
| Immigrants | Mexico | 0.0 /100 | #308 | Tragic 34.0% |
| Potawatomi | 0.0 /100 | #309 | Tragic 34.1% |
| Hondurans | 0.0 /100 | #310 | Tragic 34.2% |
| Alsatians | 0.0 /100 | #311 | Tragic 34.3% |
| Central American Indians | 0.0 /100 | #312 | Tragic 34.3% |
| Immigrants | Dominican Republic | 0.0 /100 | #313 | Tragic 34.4% |
| Chickasaw | 0.0 /100 | #314 | Tragic 34.4% |