Asian vs Comanche Single Mother Poverty
COMPARE
Asian
Comanche
Single Mother Poverty
Single Mother Poverty Comparison
Asians
Comanche
26.0%
SINGLE MOTHER POVERTY
100.0/ 100
METRIC RATING
17th/ 347
METRIC RANK
33.9%
SINGLE MOTHER POVERTY
0.0/ 100
METRIC RATING
307th/ 347
METRIC RANK
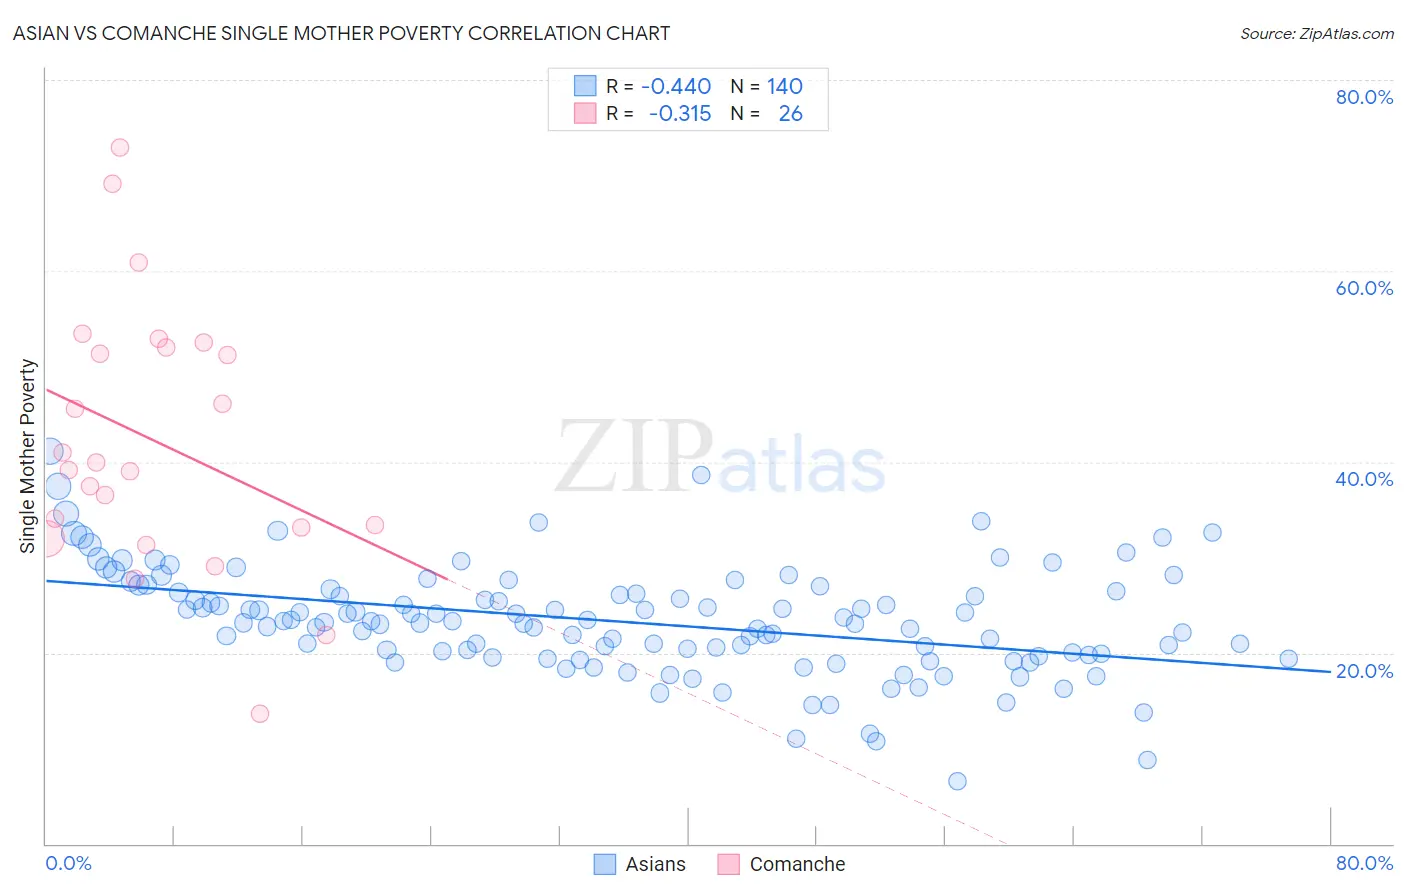
Asian vs Comanche Single Mother Poverty Correlation Chart
The statistical analysis conducted on geographies consisting of 527,260,509 people shows a moderate negative correlation between the proportion of Asians and poverty level among single mothers in the United States with a correlation coefficient (R) of -0.440 and weighted average of 26.0%. Similarly, the statistical analysis conducted on geographies consisting of 109,063,480 people shows a mild negative correlation between the proportion of Comanche and poverty level among single mothers in the United States with a correlation coefficient (R) of -0.315 and weighted average of 33.9%, a difference of 30.7%.
Single Mother Poverty Correlation Summary
| Measurement | Asian | Comanche |
| Minimum | 6.6% | 13.6% |
| Maximum | 41.1% | 73.0% |
| Range | 34.6% | 59.3% |
| Mean | 23.3% | 42.2% |
| Median | 23.3% | 39.6% |
| Interquartile 25% (IQ1) | 19.9% | 33.1% |
| Interquartile 75% (IQ3) | 26.4% | 52.0% |
| Interquartile Range (IQR) | 6.5% | 18.9% |
| Standard Deviation (Sample) | 5.6% | 13.9% |
| Standard Deviation (Population) | 5.6% | 13.6% |
Similar Demographics by Single Mother Poverty
Demographics Similar to Asians by Single Mother Poverty
In terms of single mother poverty, the demographic groups most similar to Asians are Bolivian (25.9%, a difference of 0.18%), Immigrants from Pakistan (26.0%, a difference of 0.28%), Immigrants from Eastern Asia (26.1%, a difference of 0.43%), Immigrants from Ireland (25.8%, a difference of 0.47%), and Immigrants from China (26.1%, a difference of 0.55%).
| Demographics | Rating | Rank | Single Mother Poverty |
| Immigrants | South Central Asia | 100.0 /100 | #10 | Exceptional 25.3% |
| Iranians | 100.0 /100 | #11 | Exceptional 25.5% |
| Bhutanese | 100.0 /100 | #12 | Exceptional 25.6% |
| Indians (Asian) | 100.0 /100 | #13 | Exceptional 25.8% |
| Immigrants | Singapore | 100.0 /100 | #14 | Exceptional 25.8% |
| Immigrants | Ireland | 100.0 /100 | #15 | Exceptional 25.8% |
| Bolivians | 100.0 /100 | #16 | Exceptional 25.9% |
| Asians | 100.0 /100 | #17 | Exceptional 26.0% |
| Immigrants | Pakistan | 100.0 /100 | #18 | Exceptional 26.0% |
| Immigrants | Eastern Asia | 100.0 /100 | #19 | Exceptional 26.1% |
| Immigrants | China | 100.0 /100 | #20 | Exceptional 26.1% |
| Immigrants | Bolivia | 100.0 /100 | #21 | Exceptional 26.2% |
| Immigrants | Korea | 100.0 /100 | #22 | Exceptional 26.2% |
| Burmese | 100.0 /100 | #23 | Exceptional 26.2% |
| Immigrants | Moldova | 100.0 /100 | #24 | Exceptional 26.2% |
Demographics Similar to Comanche by Single Mother Poverty
In terms of single mother poverty, the demographic groups most similar to Comanche are Immigrants from Mexico (34.0%, a difference of 0.18%), Immigrants from Congo (33.8%, a difference of 0.41%), Potawatomi (34.1%, a difference of 0.60%), Honduran (34.2%, a difference of 0.82%), and Immigrants from Central America (33.6%, a difference of 1.1%).
| Demographics | Rating | Rank | Single Mother Poverty |
| Hispanics or Latinos | 0.0 /100 | #300 | Tragic 33.3% |
| Immigrants | Somalia | 0.0 /100 | #301 | Tragic 33.4% |
| Arapaho | 0.0 /100 | #302 | Tragic 33.4% |
| Americans | 0.0 /100 | #303 | Tragic 33.5% |
| Mexicans | 0.0 /100 | #304 | Tragic 33.6% |
| Immigrants | Central America | 0.0 /100 | #305 | Tragic 33.6% |
| Immigrants | Congo | 0.0 /100 | #306 | Tragic 33.8% |
| Comanche | 0.0 /100 | #307 | Tragic 33.9% |
| Immigrants | Mexico | 0.0 /100 | #308 | Tragic 34.0% |
| Potawatomi | 0.0 /100 | #309 | Tragic 34.1% |
| Hondurans | 0.0 /100 | #310 | Tragic 34.2% |
| Alsatians | 0.0 /100 | #311 | Tragic 34.3% |
| Central American Indians | 0.0 /100 | #312 | Tragic 34.3% |
| Immigrants | Dominican Republic | 0.0 /100 | #313 | Tragic 34.4% |
| Chickasaw | 0.0 /100 | #314 | Tragic 34.4% |